Master microclimate forecasting with modern satellite apps. Learn GFS vs. ECMWF models, barometric tracking, and radar loops for safe wilderness navigation.
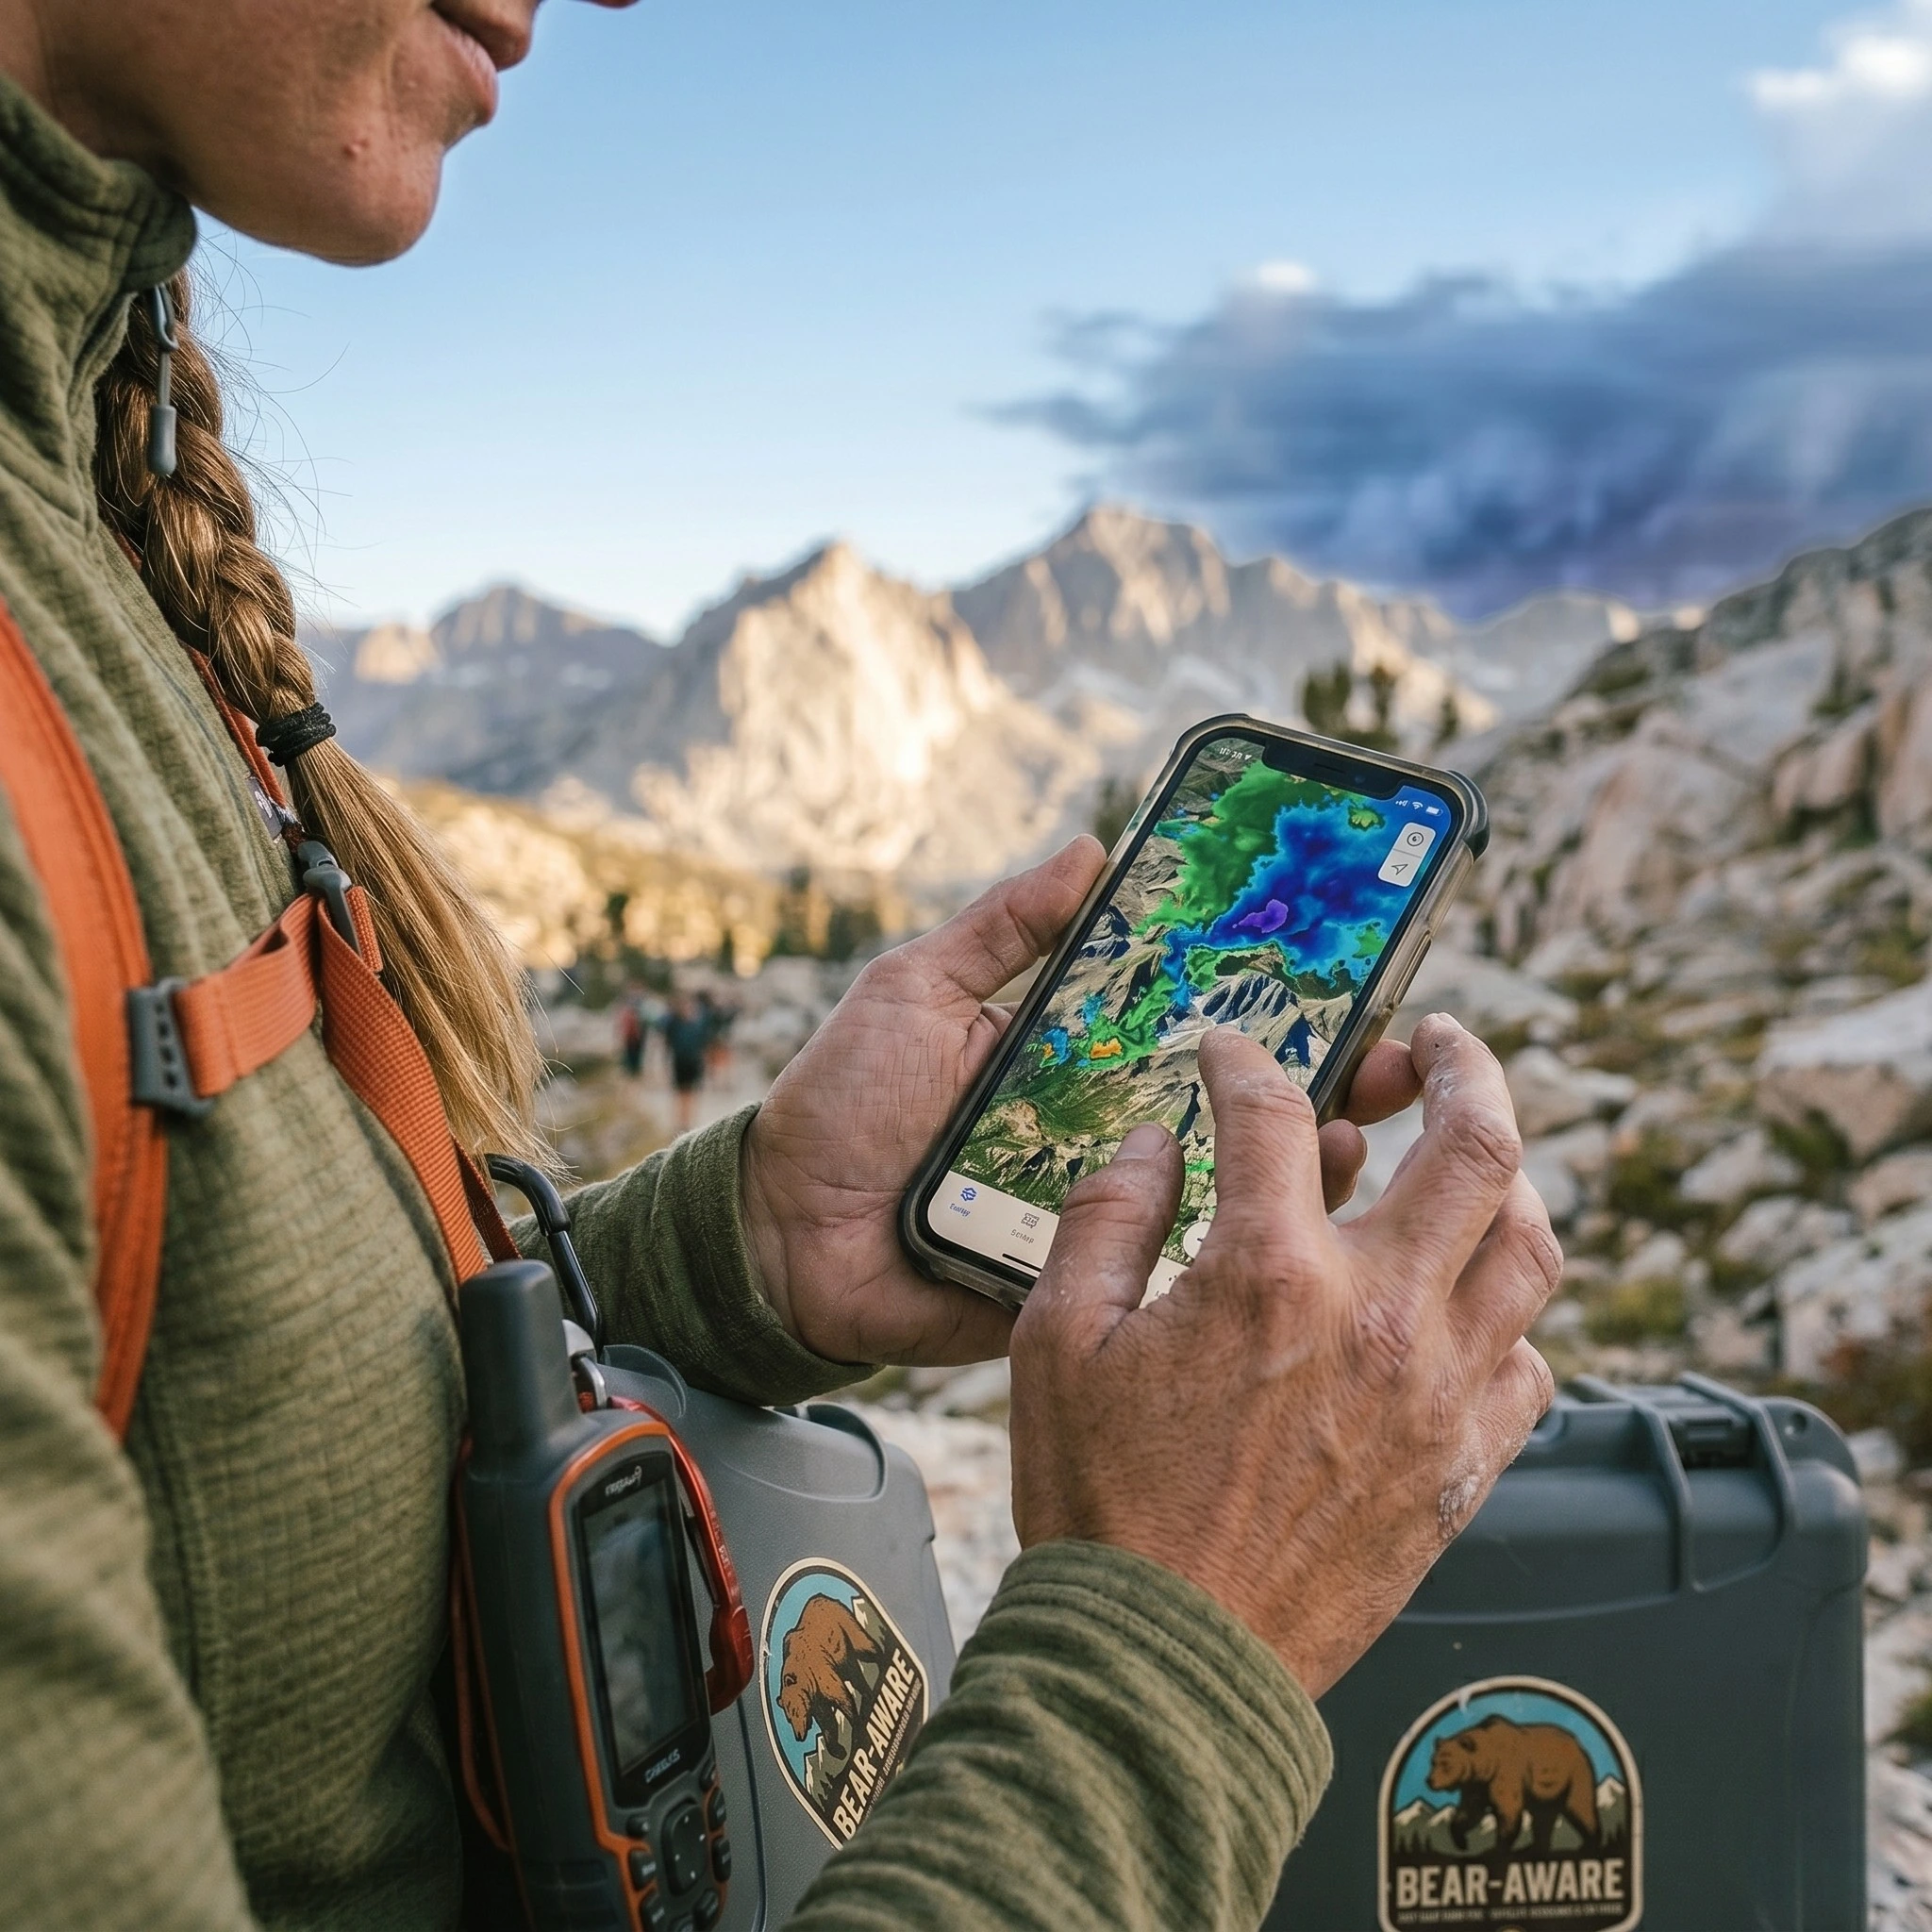
Table of Contents
Introduction: The Atmospheric Reality of Wilderness Travel
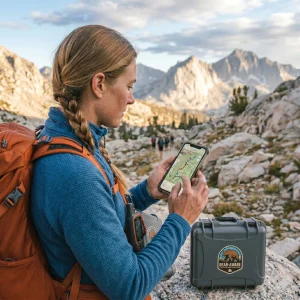
Developing a system to predict trail weather is a foundational safety protocol for any self-contained outdoor expedition. In remote mountain corridors, weather is not merely an inconvenience; it is a dynamic hazard capable of altering trail conditions within minutes. For those who have already completed the Bikepacking for Beginners transition, mastering microclimate forecasting is the next phase in achieving complete trail autonomy. Relying solely on a static, pre-departure regional forecast is insufficient when navigating complex topographic structures.
The primary objective of advanced weather tracking is the prevention of exposure-related emergencies. When utilizing digital tools for Off-Road Navigation, understanding the physical mechanisms behind barometric drift, wind shear, and convective development is paramount. An prepared navigator treats atmospheric data with the same precision as trail coordinates. This guide provides a technical analysis of how to read global forecasting models, interpret satellite overlays, and configure hardware to maintain safety on remote Bikepacking Routes.
1. Understanding Meteorological Models: GFS vs. ECMWF
To accurately predict trail weather, one must understand the distinct mathematical frameworks that generate digital forecasts. Mobile weather applications do not create their own data; instead, they display outputs from global numerical weather prediction (NWP) models. The two most prominent models are the Global Forecast System (GFS) and the European Centre for Medium-Range Weather Forecasts (ECMWF).
The Global Forecast System (GFS)
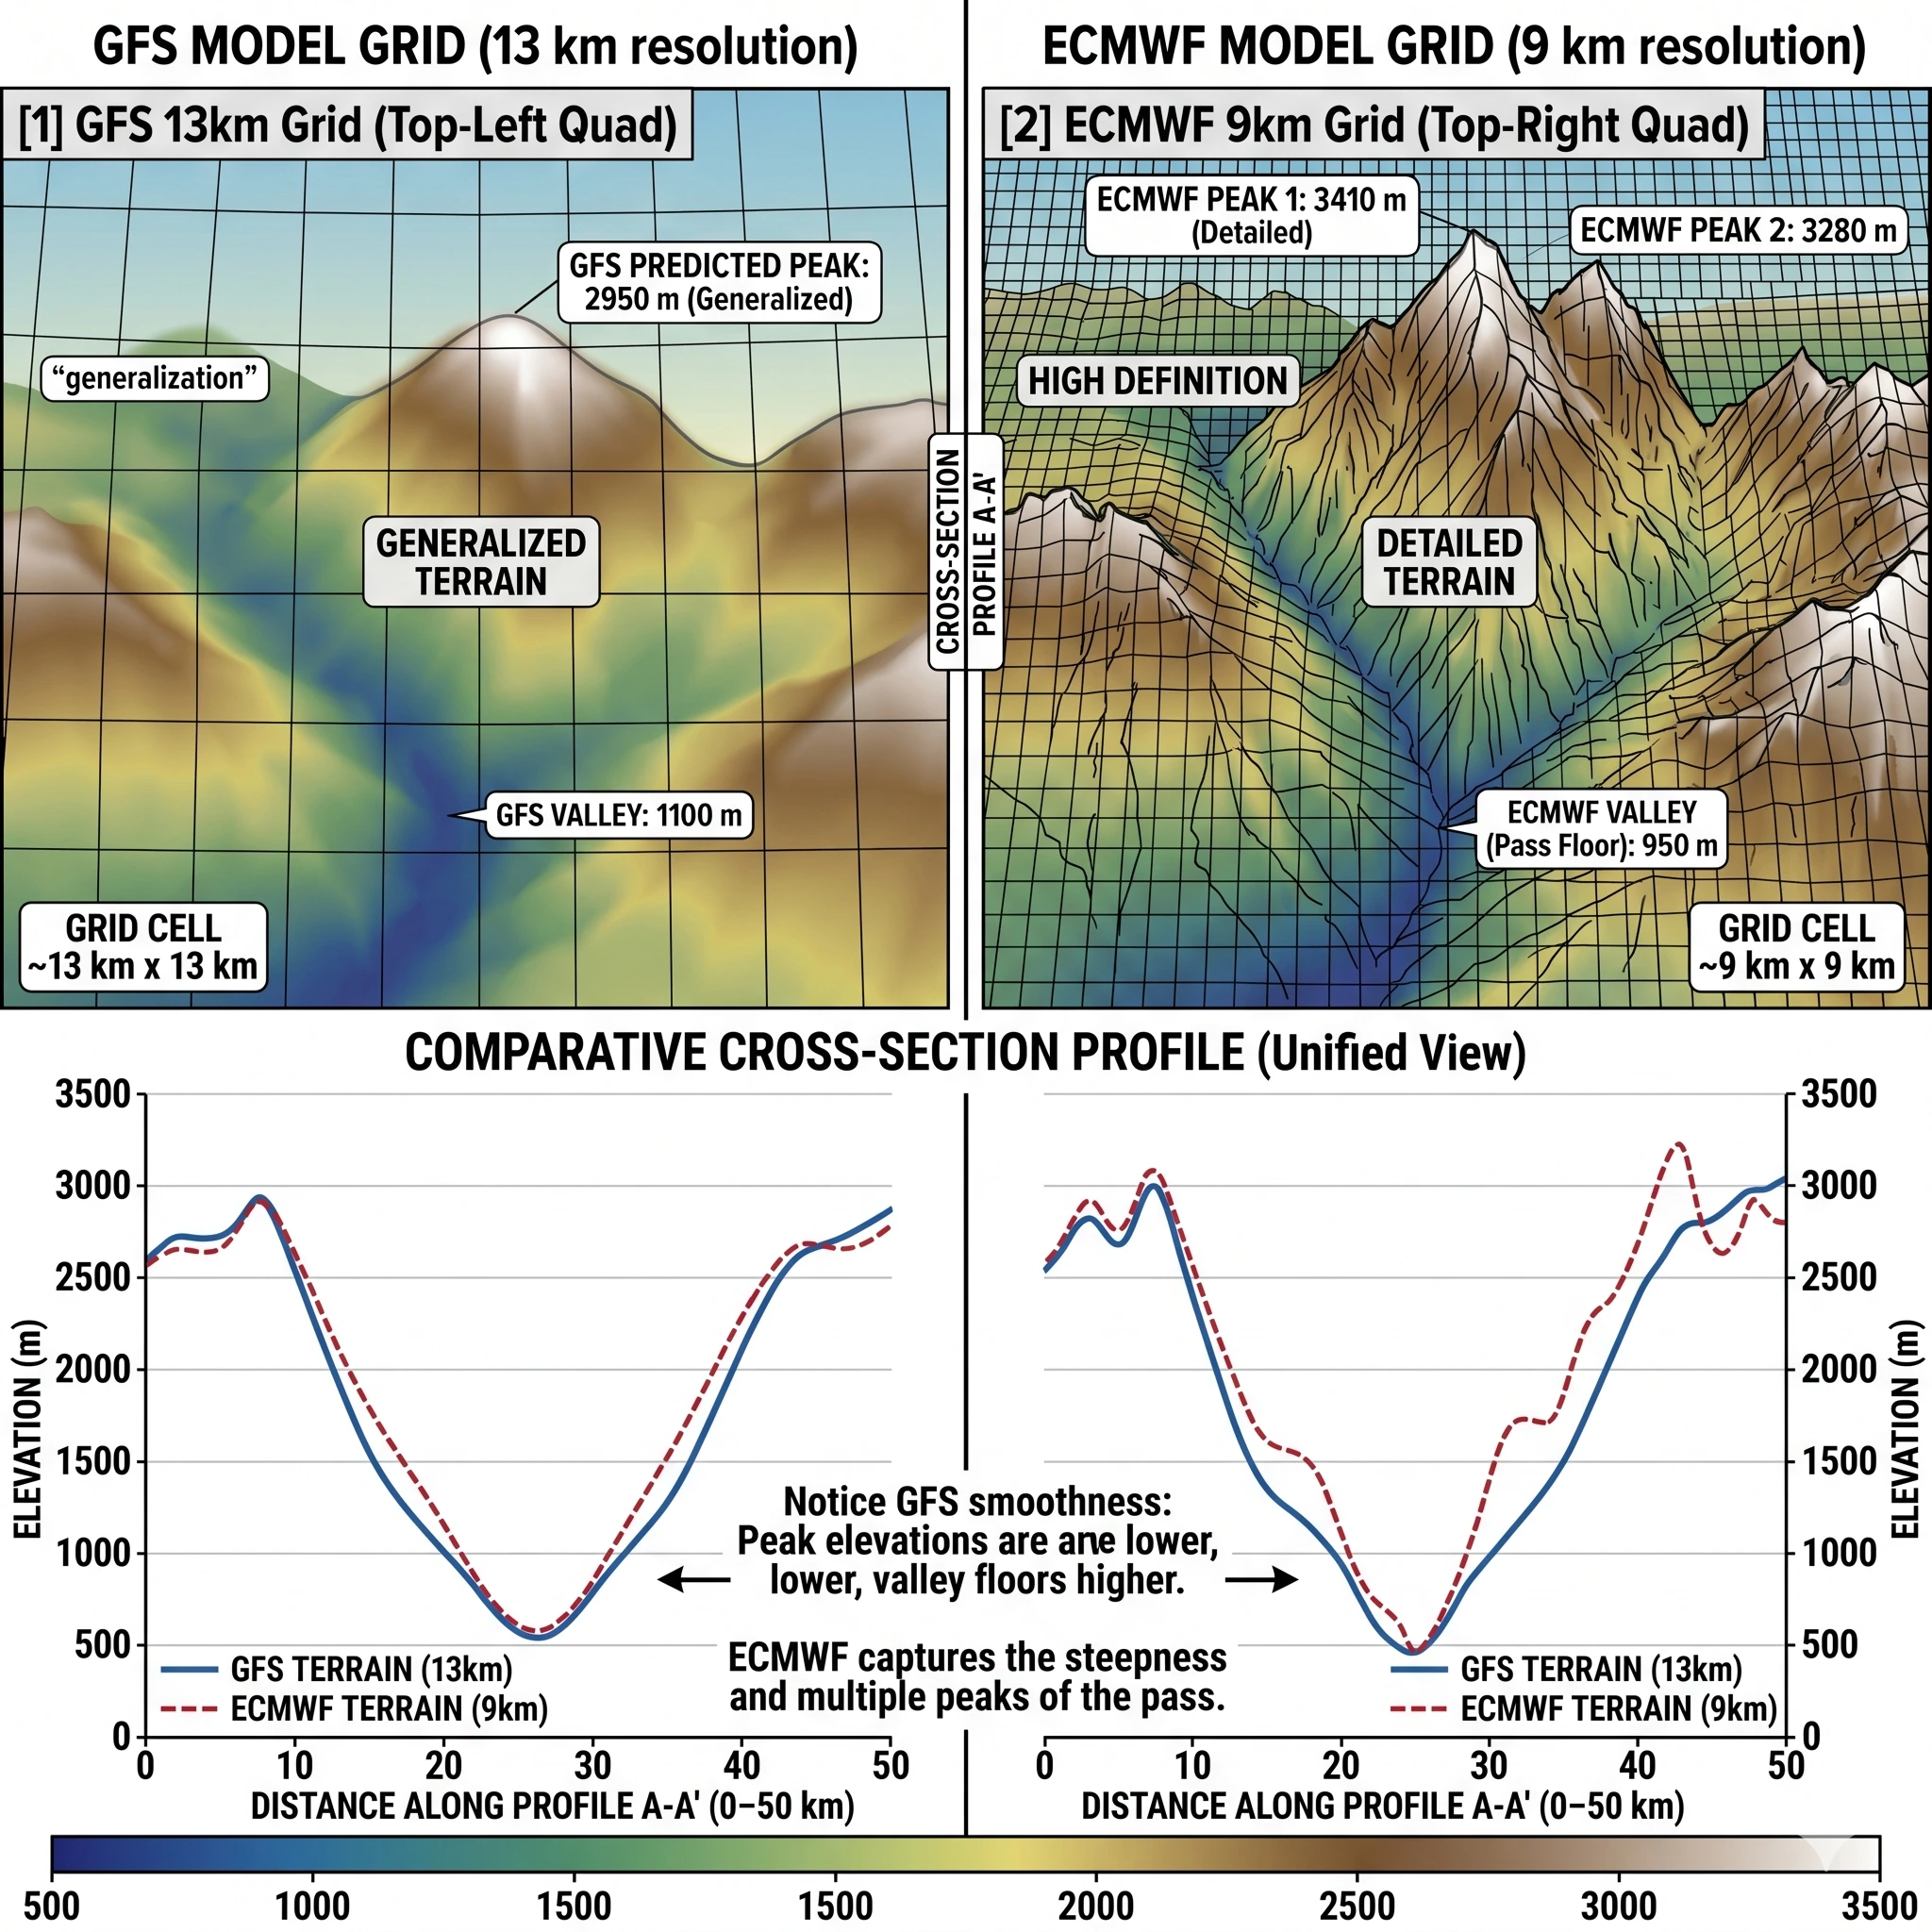
Managed by the NOAA Weather Monitoring agency, the GFS is a free, open-access model updated four times daily. It operates on a horizontal grid resolution of approximately 13 kilometers. While highly reliable for macro-scale storm tracking, its wider grid spacing can struggle to resolve localized mountain valleys and thermal anomalies.
The European Model (ECMWF)
The ECMWF Meteorological Data model is widely considered the gold standard for mid-range forecasting, operating on a high-resolution 9-kilometer grid. This tighter resolution provides superior accuracy when predicting orographic precipitation and temperature inversions along complex slopes. Most premium apps require a subscription to access raw ECMWF data, which is a highly recommended investment for remote wilderness travel.
2. Mastering Real-Time Radar Interpretation
Radar overlays are the most critical tool for short-term convective tracking. Standard weather apps show base reflectivity, which measures the strength of the energy reflected back to the radar antenna from hydrometeors (rain, snow, hail).
Reflectivity and Storm Severity
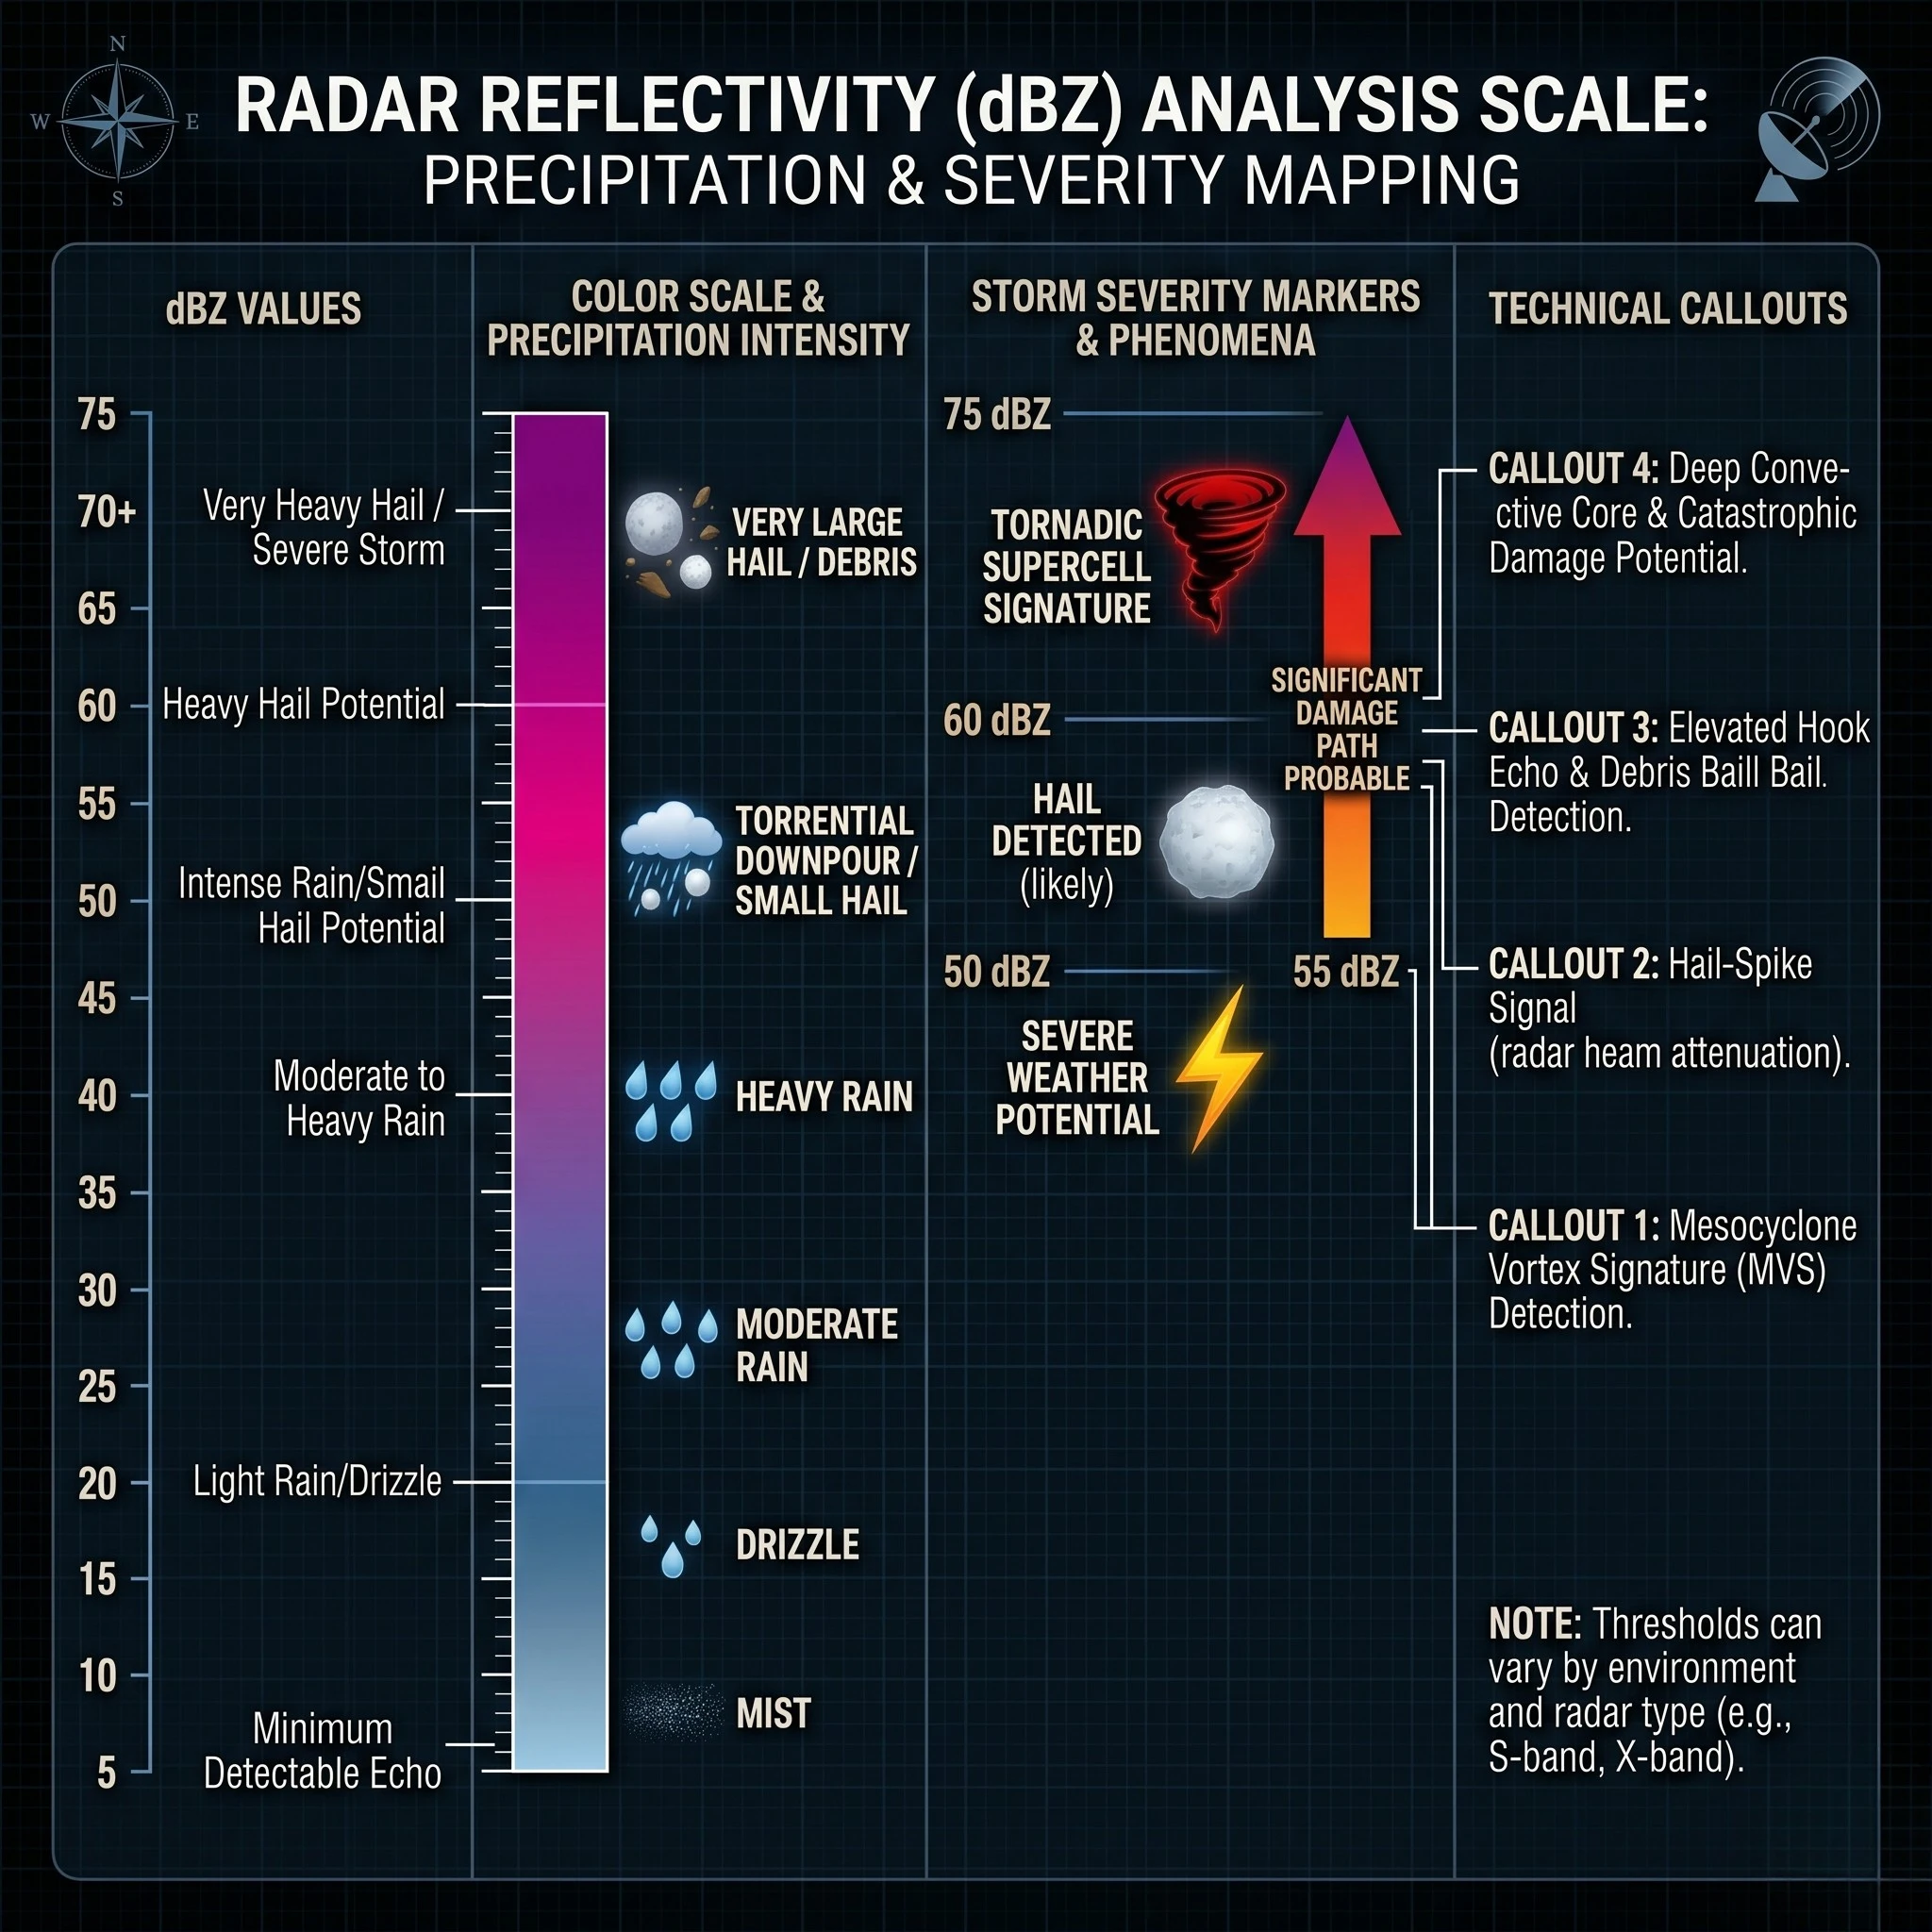
Reflectivity is measured in decibels of reflectivity ($Z$), expressed as $\text{dBZ}$. The scale typically ranges from 5 $\text{dBZ}$ (light mist) to 75 $\text{dBZ}$ (extreme hail).
- Green/Blue (15–30 dBZ): Indicates light to moderate stratiform rain.
- Yellow/Orange (35–45 dBZ): Signals convective cells with moderate to heavy precipitation.
- Red/Magenta (50+ dBZ): Warns of severe thunderstorms, high winds, and potential hail.
Analyzing Radar Loop Vectoring
A single static radar image is of limited utility. The navigator must loop the radar for at least 30 minutes to determine the storm’s velocity, direction of travel (vectoring), and rate of intensification. If a convective cell is moving parallel to your valley corridor, the duration of exposure will be maximized. Understanding this movement is critical for preparing your Bikepacking Sleeping Systems before precipitation begins. For official real-time radar data, consult the National Weather Service.
3. Windy App: The Gold Standard for Wind and Jet Stream Analysis
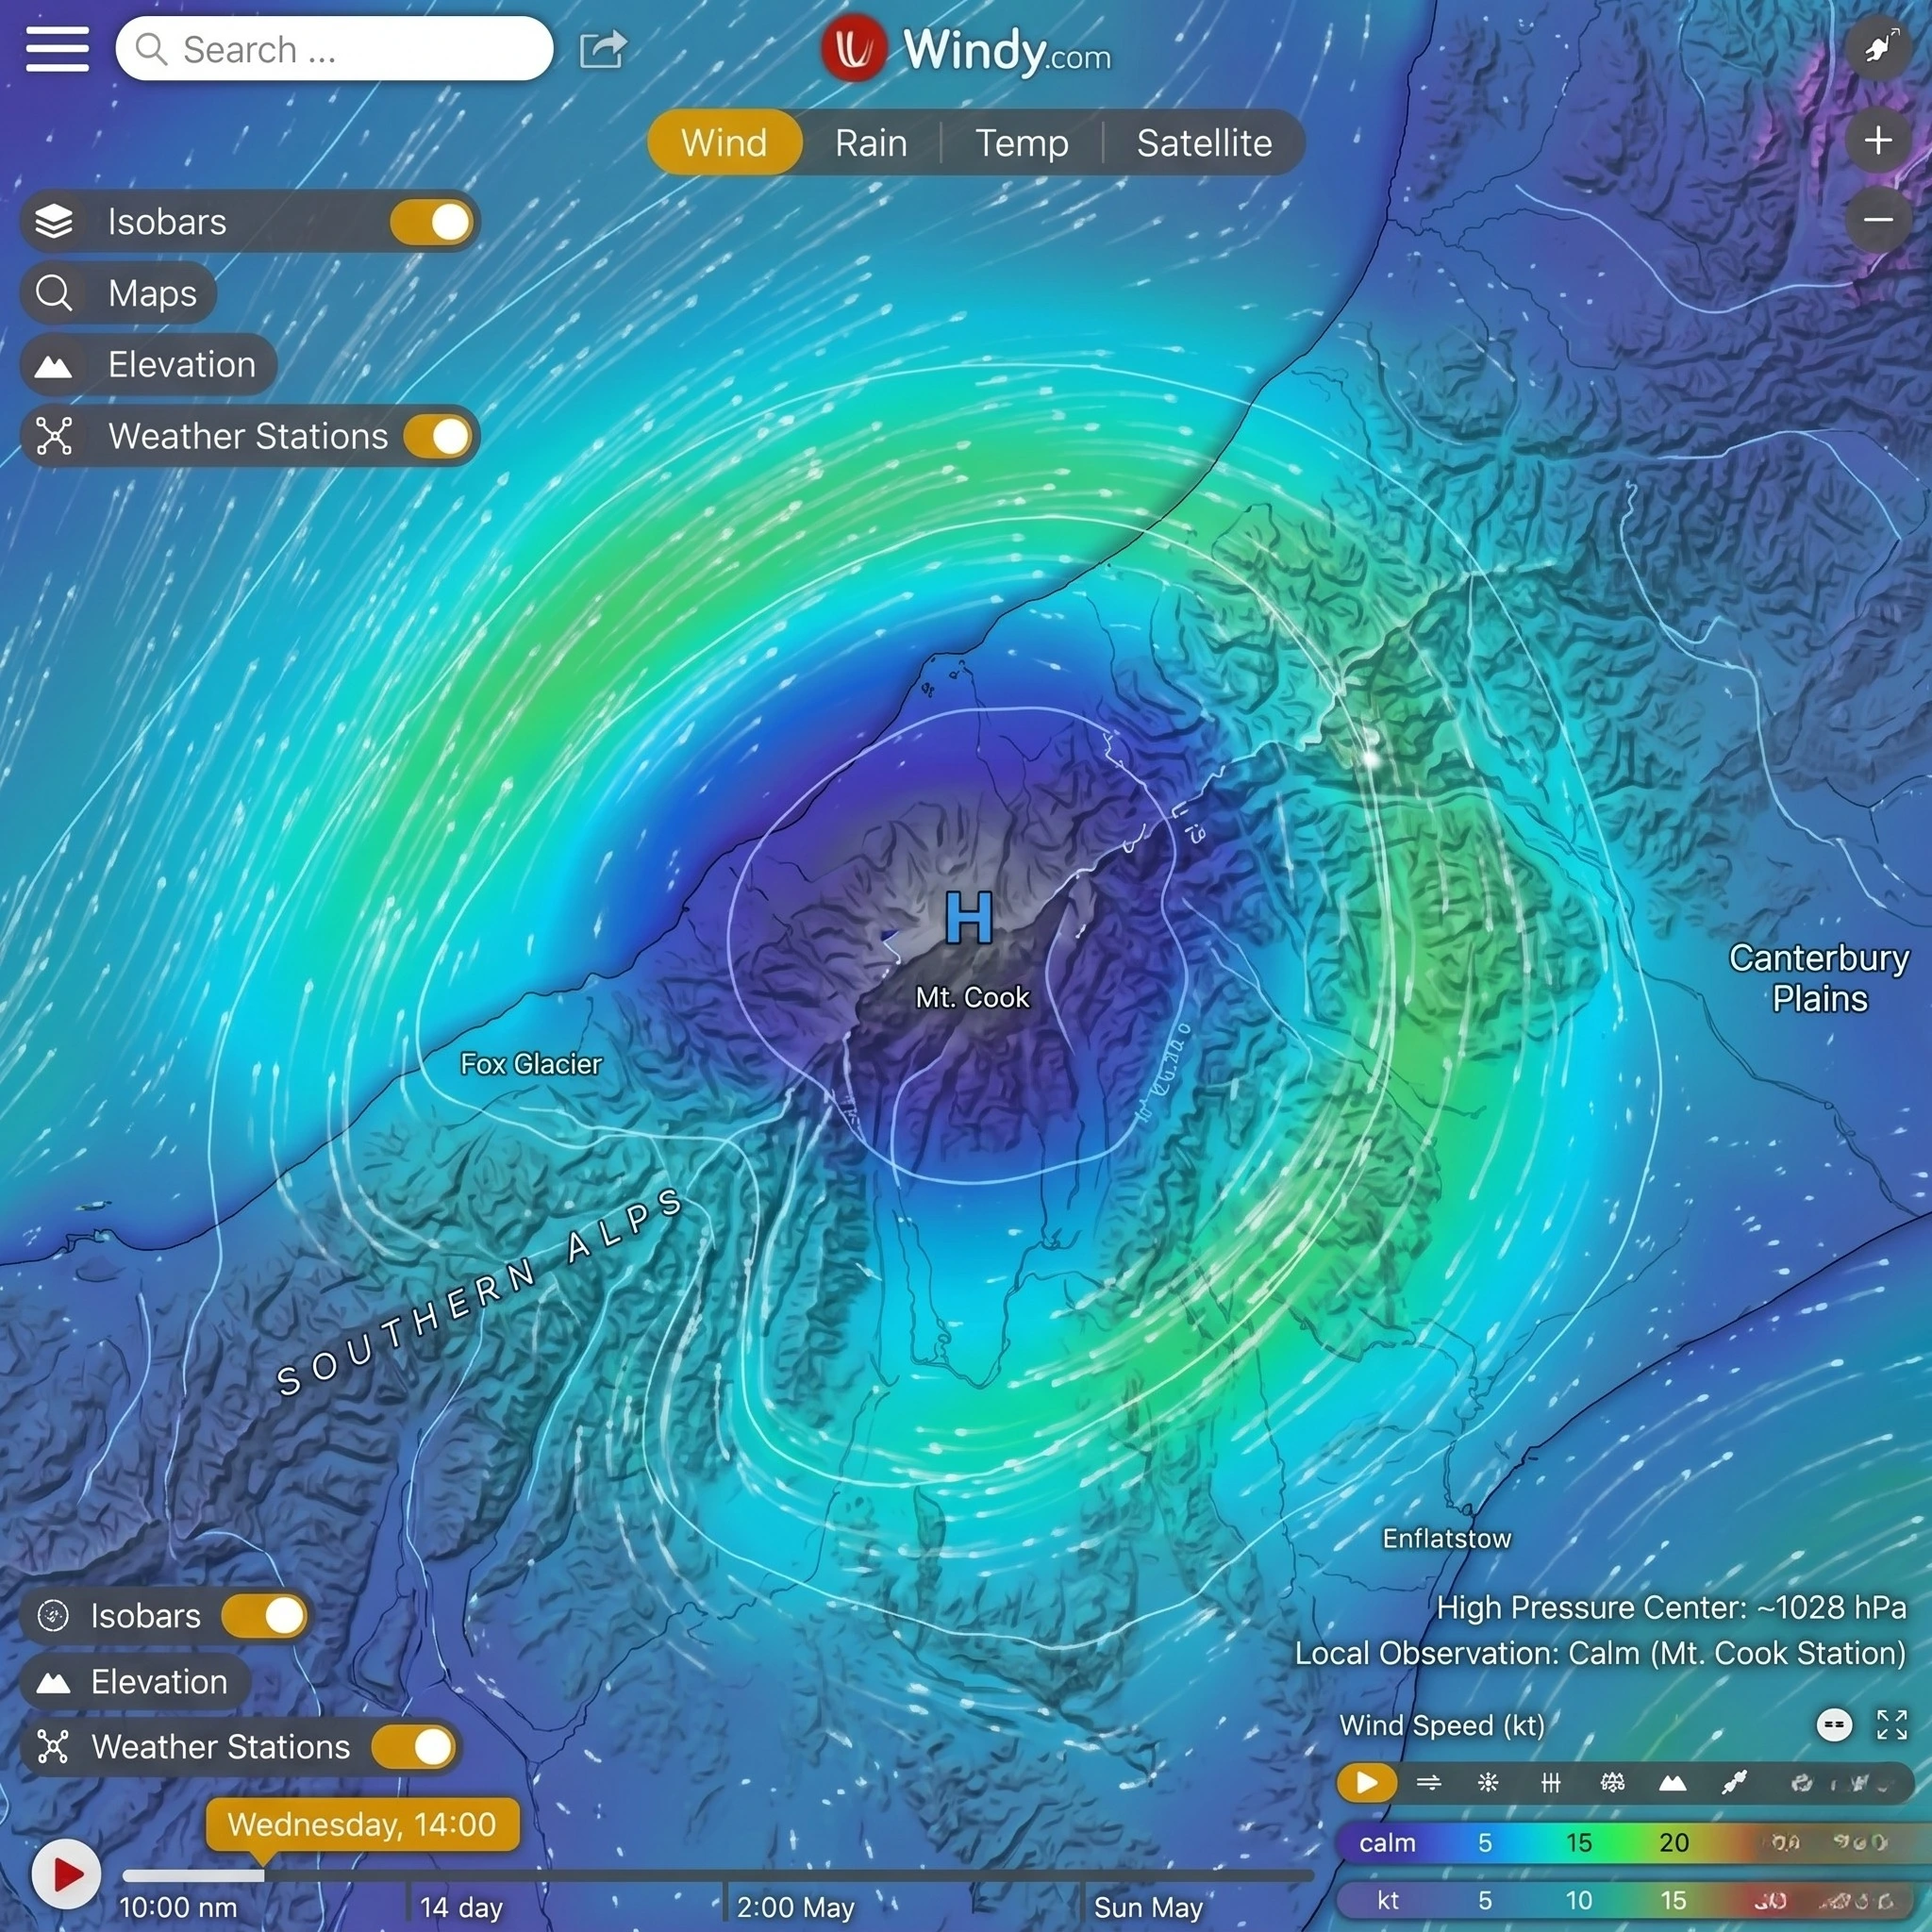
For advanced microclimate forecasting, the Windy App Interface is an indispensable resource. Unlike basic consumer weather apps, it allows users to overlay multiple wind, pressure, and temperature layers to visualize atmospheric fluid dynamics in real time.
Technical Key Interface Features
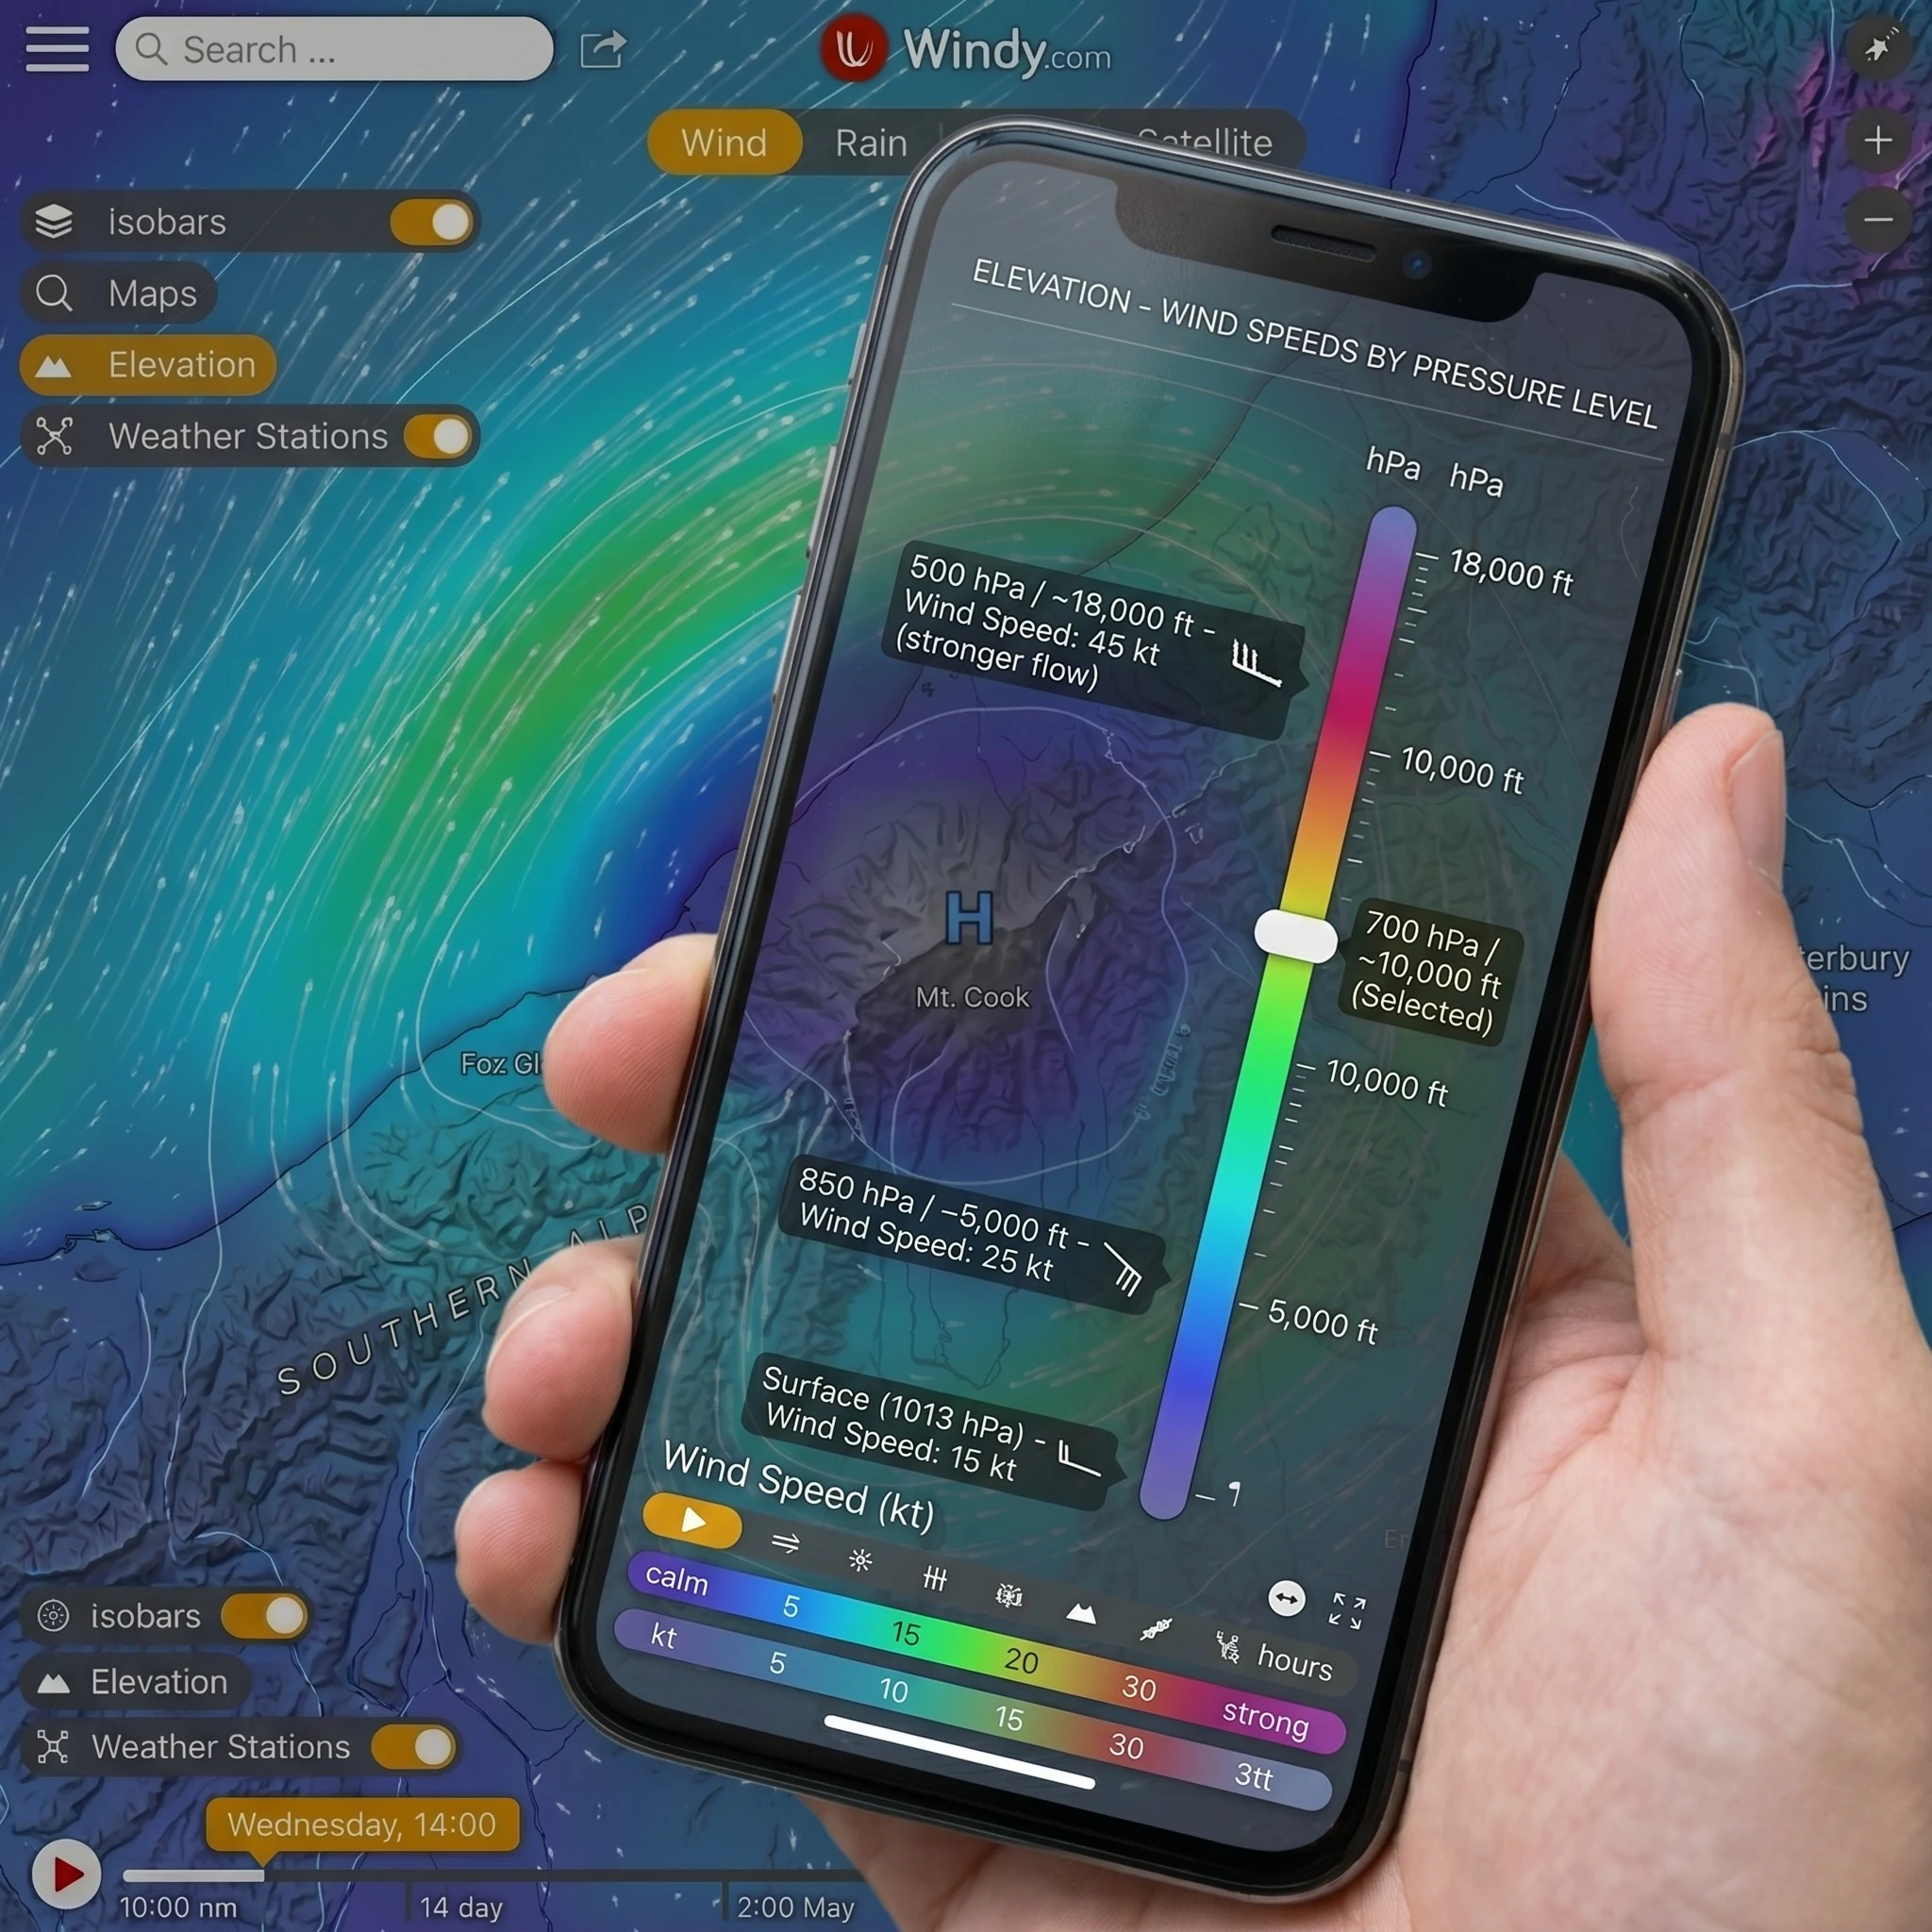
Windy displays wind vectors as moving particles, making it easy to identify wind shear and pressure boundaries. By adjusting the altitude slider, the user can analyze wind speed from ground level up to the jet stream level ($30,000\text{ feet}$). High wind speeds at upper levels often indicate the fast approach of a low-pressure front, even if ground-level winds are currently calm.
Pros and Cons of Windy
- Pros: Access to multiple NWP models (ECMWF, GFS, ICON, HRRR); real-time satellite and radar integration; advanced cape (Convective Available Potential Energy) indexing.
- Cons: High battery consumption due to continuous graphic rendering; steep learning curve for non-meteorologists.
4. Satellite Imagery: Visible, Infrared, and Water Vapor Layers
When outside of terrestrial radar range, satellite imagery is the primary method used to predict trail weather. Modern applications offer three distinct satellite views, each serving a specific analytical purpose.
Visible Satellite Imagery
This layer mimics a standard photograph taken from space. It offers the highest resolution for identifying cloud structures, fog banks, and snow cover. However, because it relies on reflected sunlight, visible satellite imagery is completely useless during night hours.
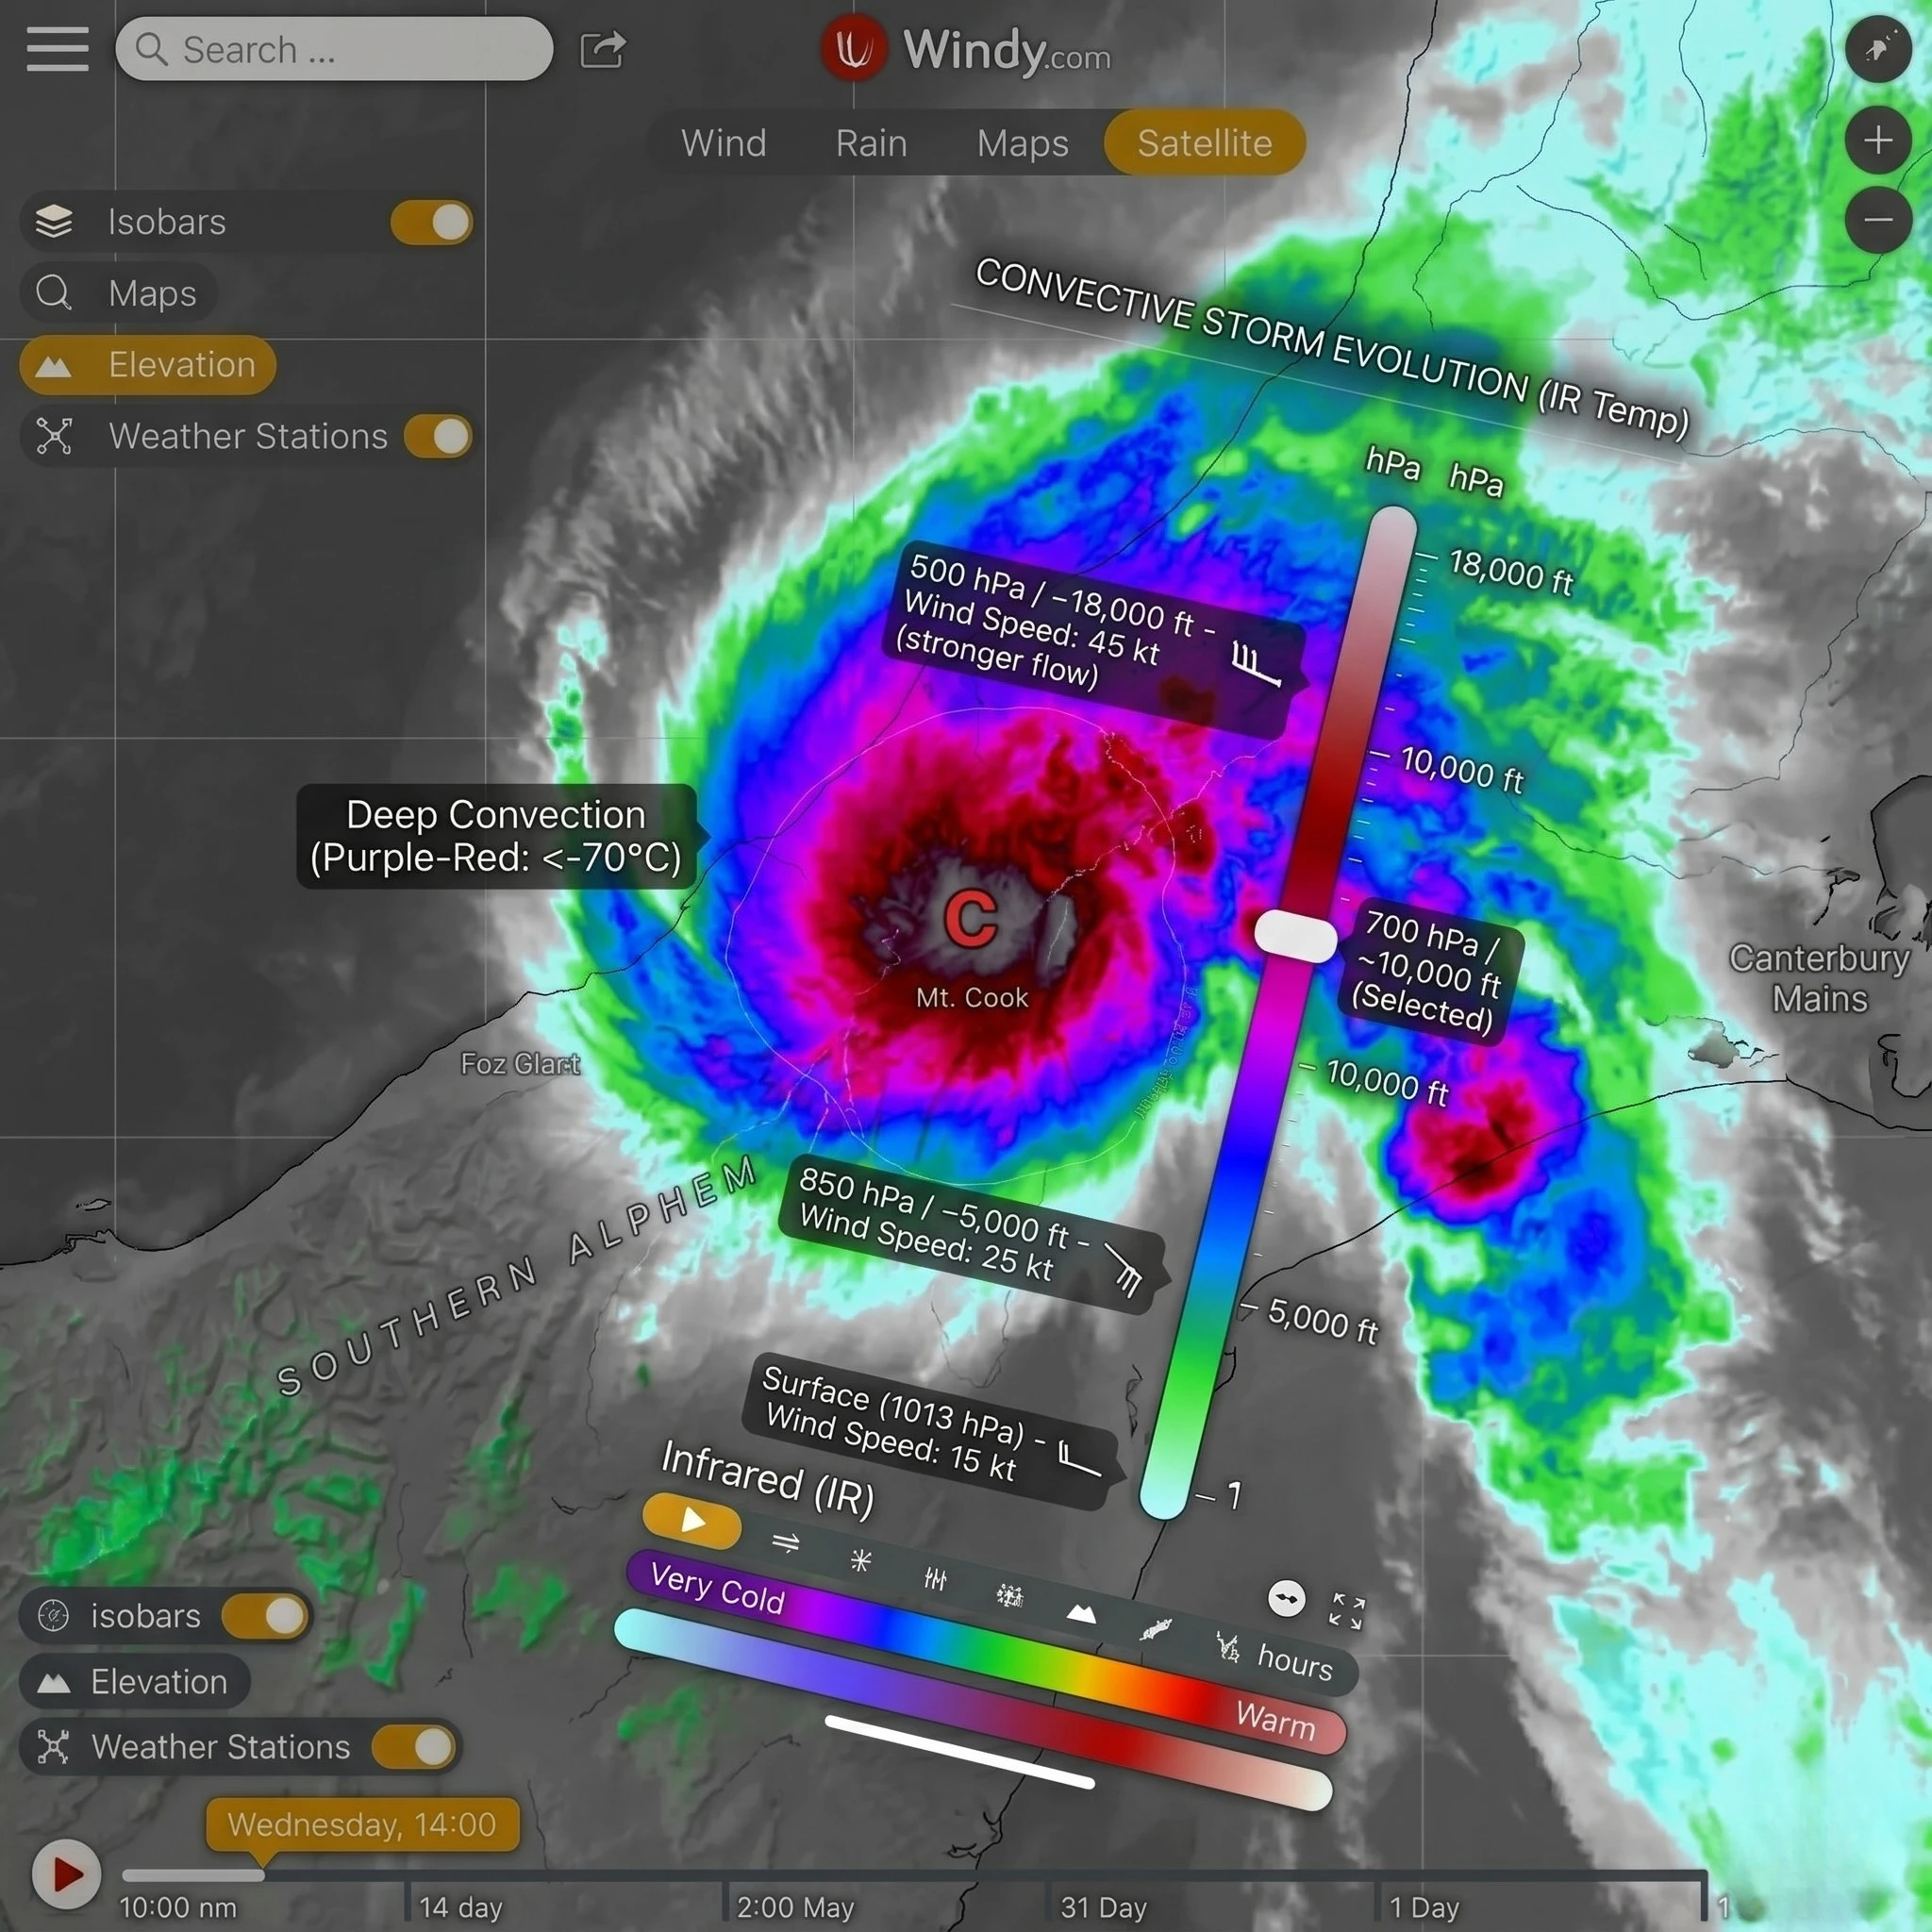
Infrared (IR) Satellite Imagery
IR sensors measure cloud-top temperatures. Because temperature decreases with altitude in the troposphere, colder cloud tops (indicated by bright whites or color-coded reds) represent taller, more developed clouds. This is the primary tool for identifying growing cumulonimbus clouds and nocturnal thunderstorm development. This imagery is essential when packing your Bikepacking Food Ideas securely to prevent moisture damage.
Water Vapor Imagery
This layer measures mid-to-upper-level moisture content in the atmosphere, even in areas without cloud cover. It is highly effective for identifying jet stream placement and the boundaries between dry, stable air masses and humid, unstable air.
5. Integrating Barometric Pressure Trends and Altimeter Setup
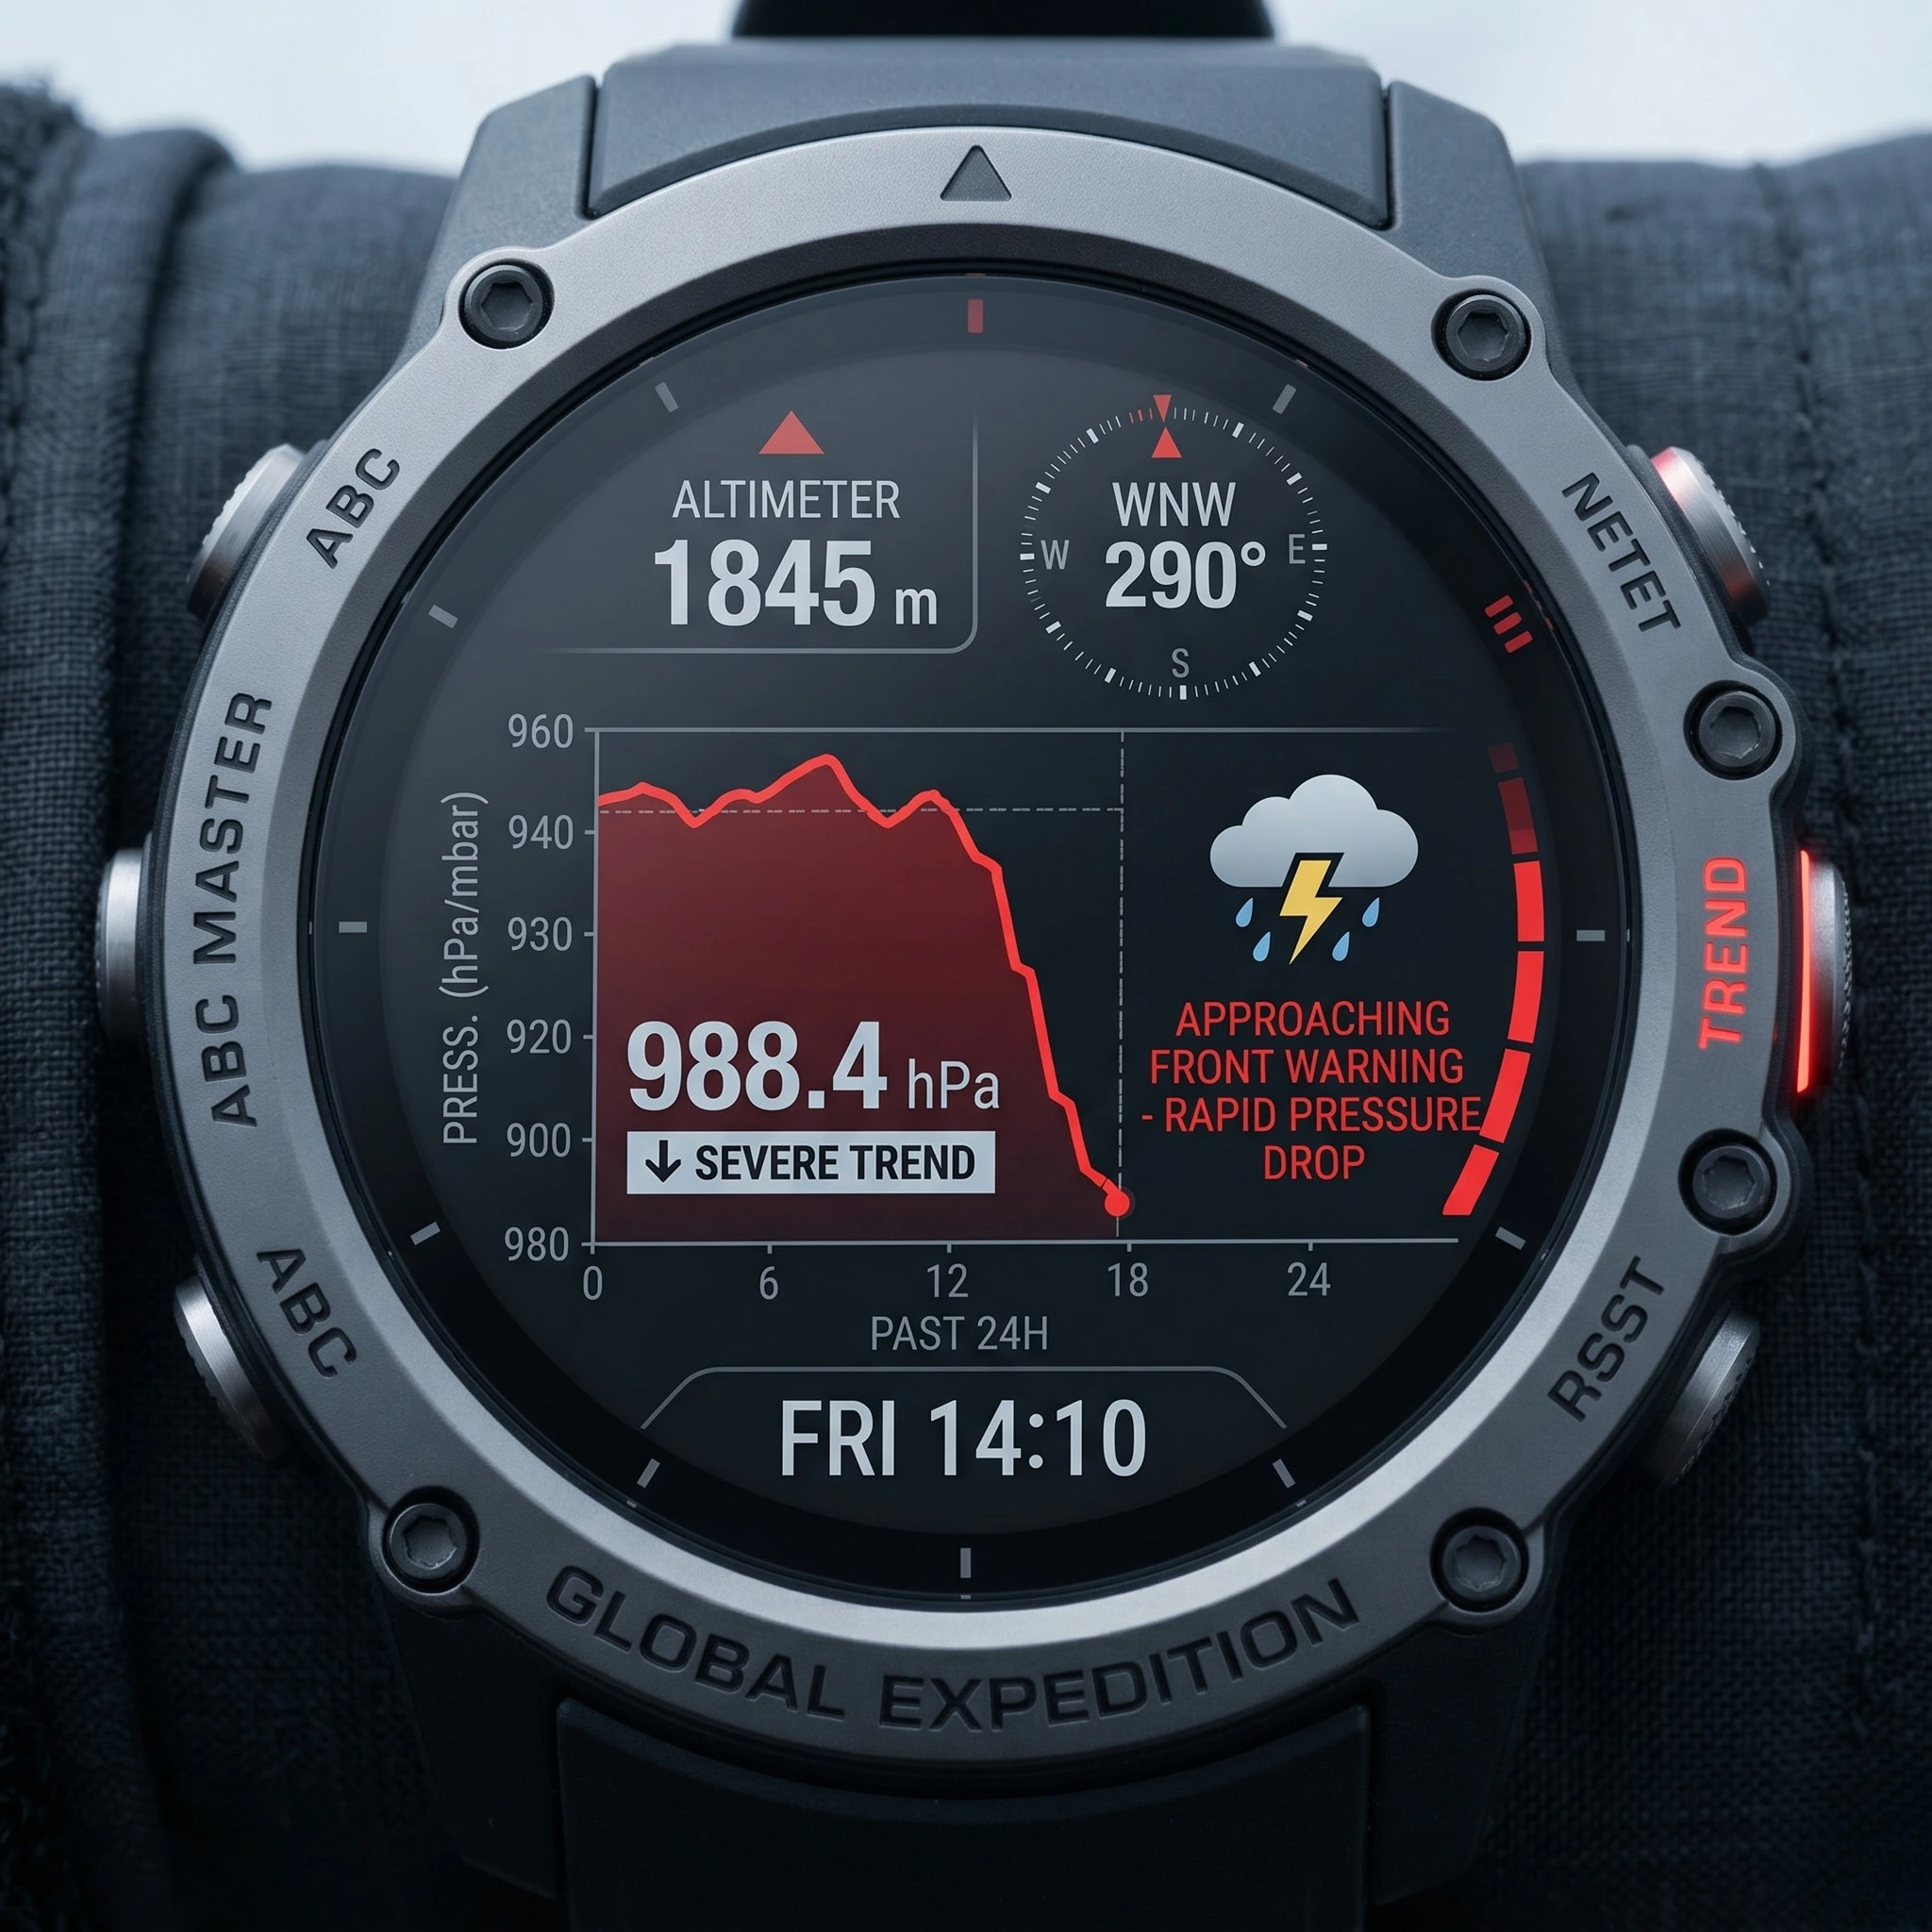
A primary rule of backcountry meteorology is: pressure changes precede weather changes. Most modern sports watches and GPS units contain a barometric altimeter that can be configured to track atmospheric pressure trends over a 12-to-24-hour window.
The Physics of Barometric Drift
As a general rule, a falling barometer indicates the approach of a low-pressure system (instability, wind, and precipitation). Conversely, a rising barometer indicates the arrival of a high-pressure ridge (stability and dry air). This pressure relationship is expressed by the hydrostatic equation:$$\frac{\partial p}{\partial z} = -\rho g$$
Where:
- $p$ is atmospheric pressure
- $z$ is altitude
- $\rho$ is air density
- $g$ is the acceleration due to gravity
Calibrating Your Altimeter
To track weather trends accurately while stationary, the altimeter must be calibrated at a known elevation point. If the indicated altitude rises while you are remaining at a fixed camp, it means the atmospheric pressure is dropping, signaling an approaching storm. This calibration is an essential skill taught in our Bikepacking Packing Guide tutorials.
6. Predicting Orographic Lift and Mountain Microclimates
Standard weather forecasts cannot account for the dramatic microclimates created by mountain topography. The most influential mechanism in mountain weather is “orographic lift.”
The Mechanics of Orographic Precipitation
When a humid air mass is forced upward by a mountain range, it cools adiabatically. As the temperature drops to the dew point, relative humidity reaches 100%, leading to condensation and heavy precipitation on the windward side of the range. The rate of cooling for dry air is $\Gamma_d \approx 9.8^\circ\text{C/km}$ ($5.38^\circ\text{F}/1000\text{ ft}$), while moist air cools at the moist adiabatic lapse rate ($\Gamma_s \approx 5^\circ\text{C/km}$).$$\Gamma = -\frac{dT}{dz}$$
Where:
- $T$ is temperature
- $z$ is altitude
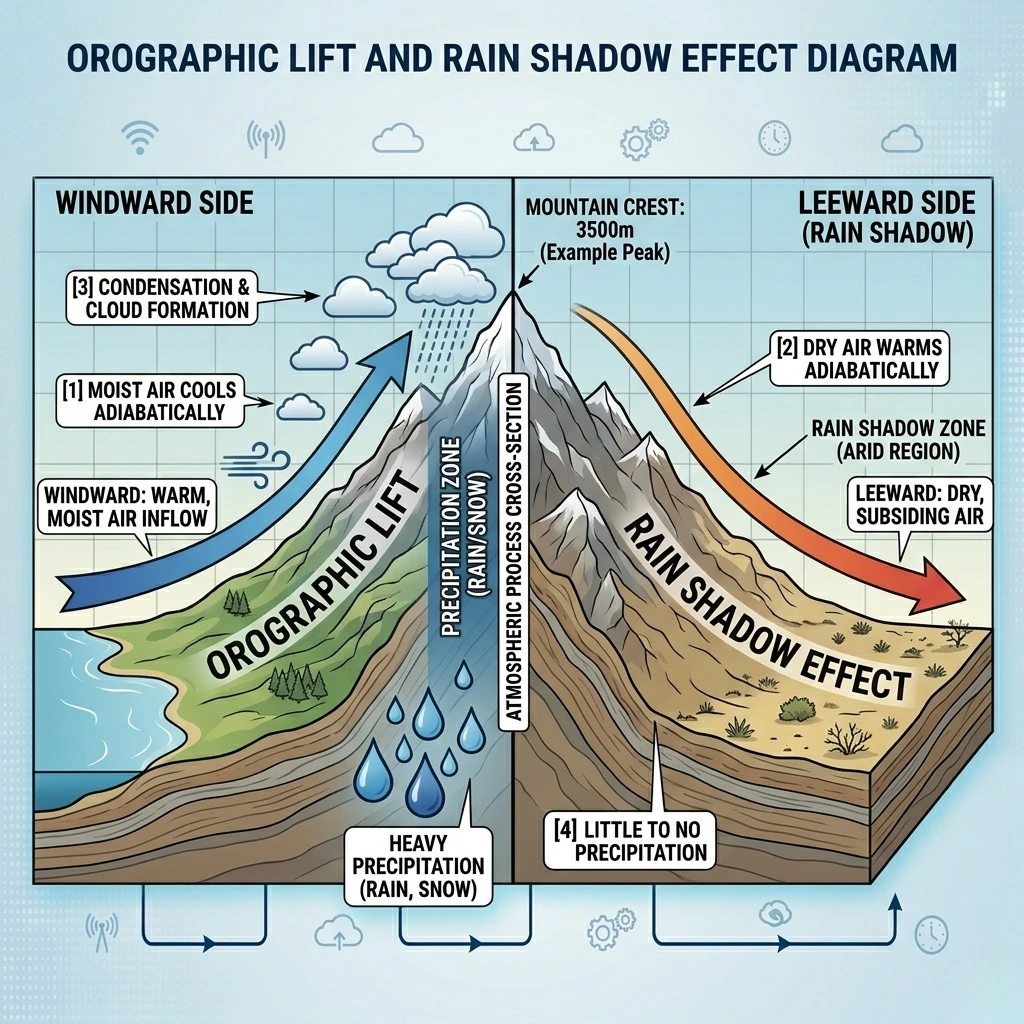
The Rain Shadow Effect
Once the air mass crosses the summit, it descends and warms adiabatically. This dry, warm air creates a “rain shadow” on the leeward side of the range, resulting in arid conditions. When planning Difficult Routes, the navigator must study wind directions relative to mountain ridges to anticipate which valleys will receive heavy rainfall and which will remain dry. This environmental awareness is a core component of Eco-Friendly Bikepacking and safety.
7. Utilizing Offline Meteorological Caching Protocols
In deep wilderness areas, data connections are lost. The navigator must establish a “caching protocol” to preserve weather data offline before entering dead zones.
Caching Satellite Overlays
Many advanced mapping applications, such as Gaia GPS or OnX Backcountry, allow users to download topographic maps with active weather radar layers cached. The user must download these files immediately before leaving cellular service.
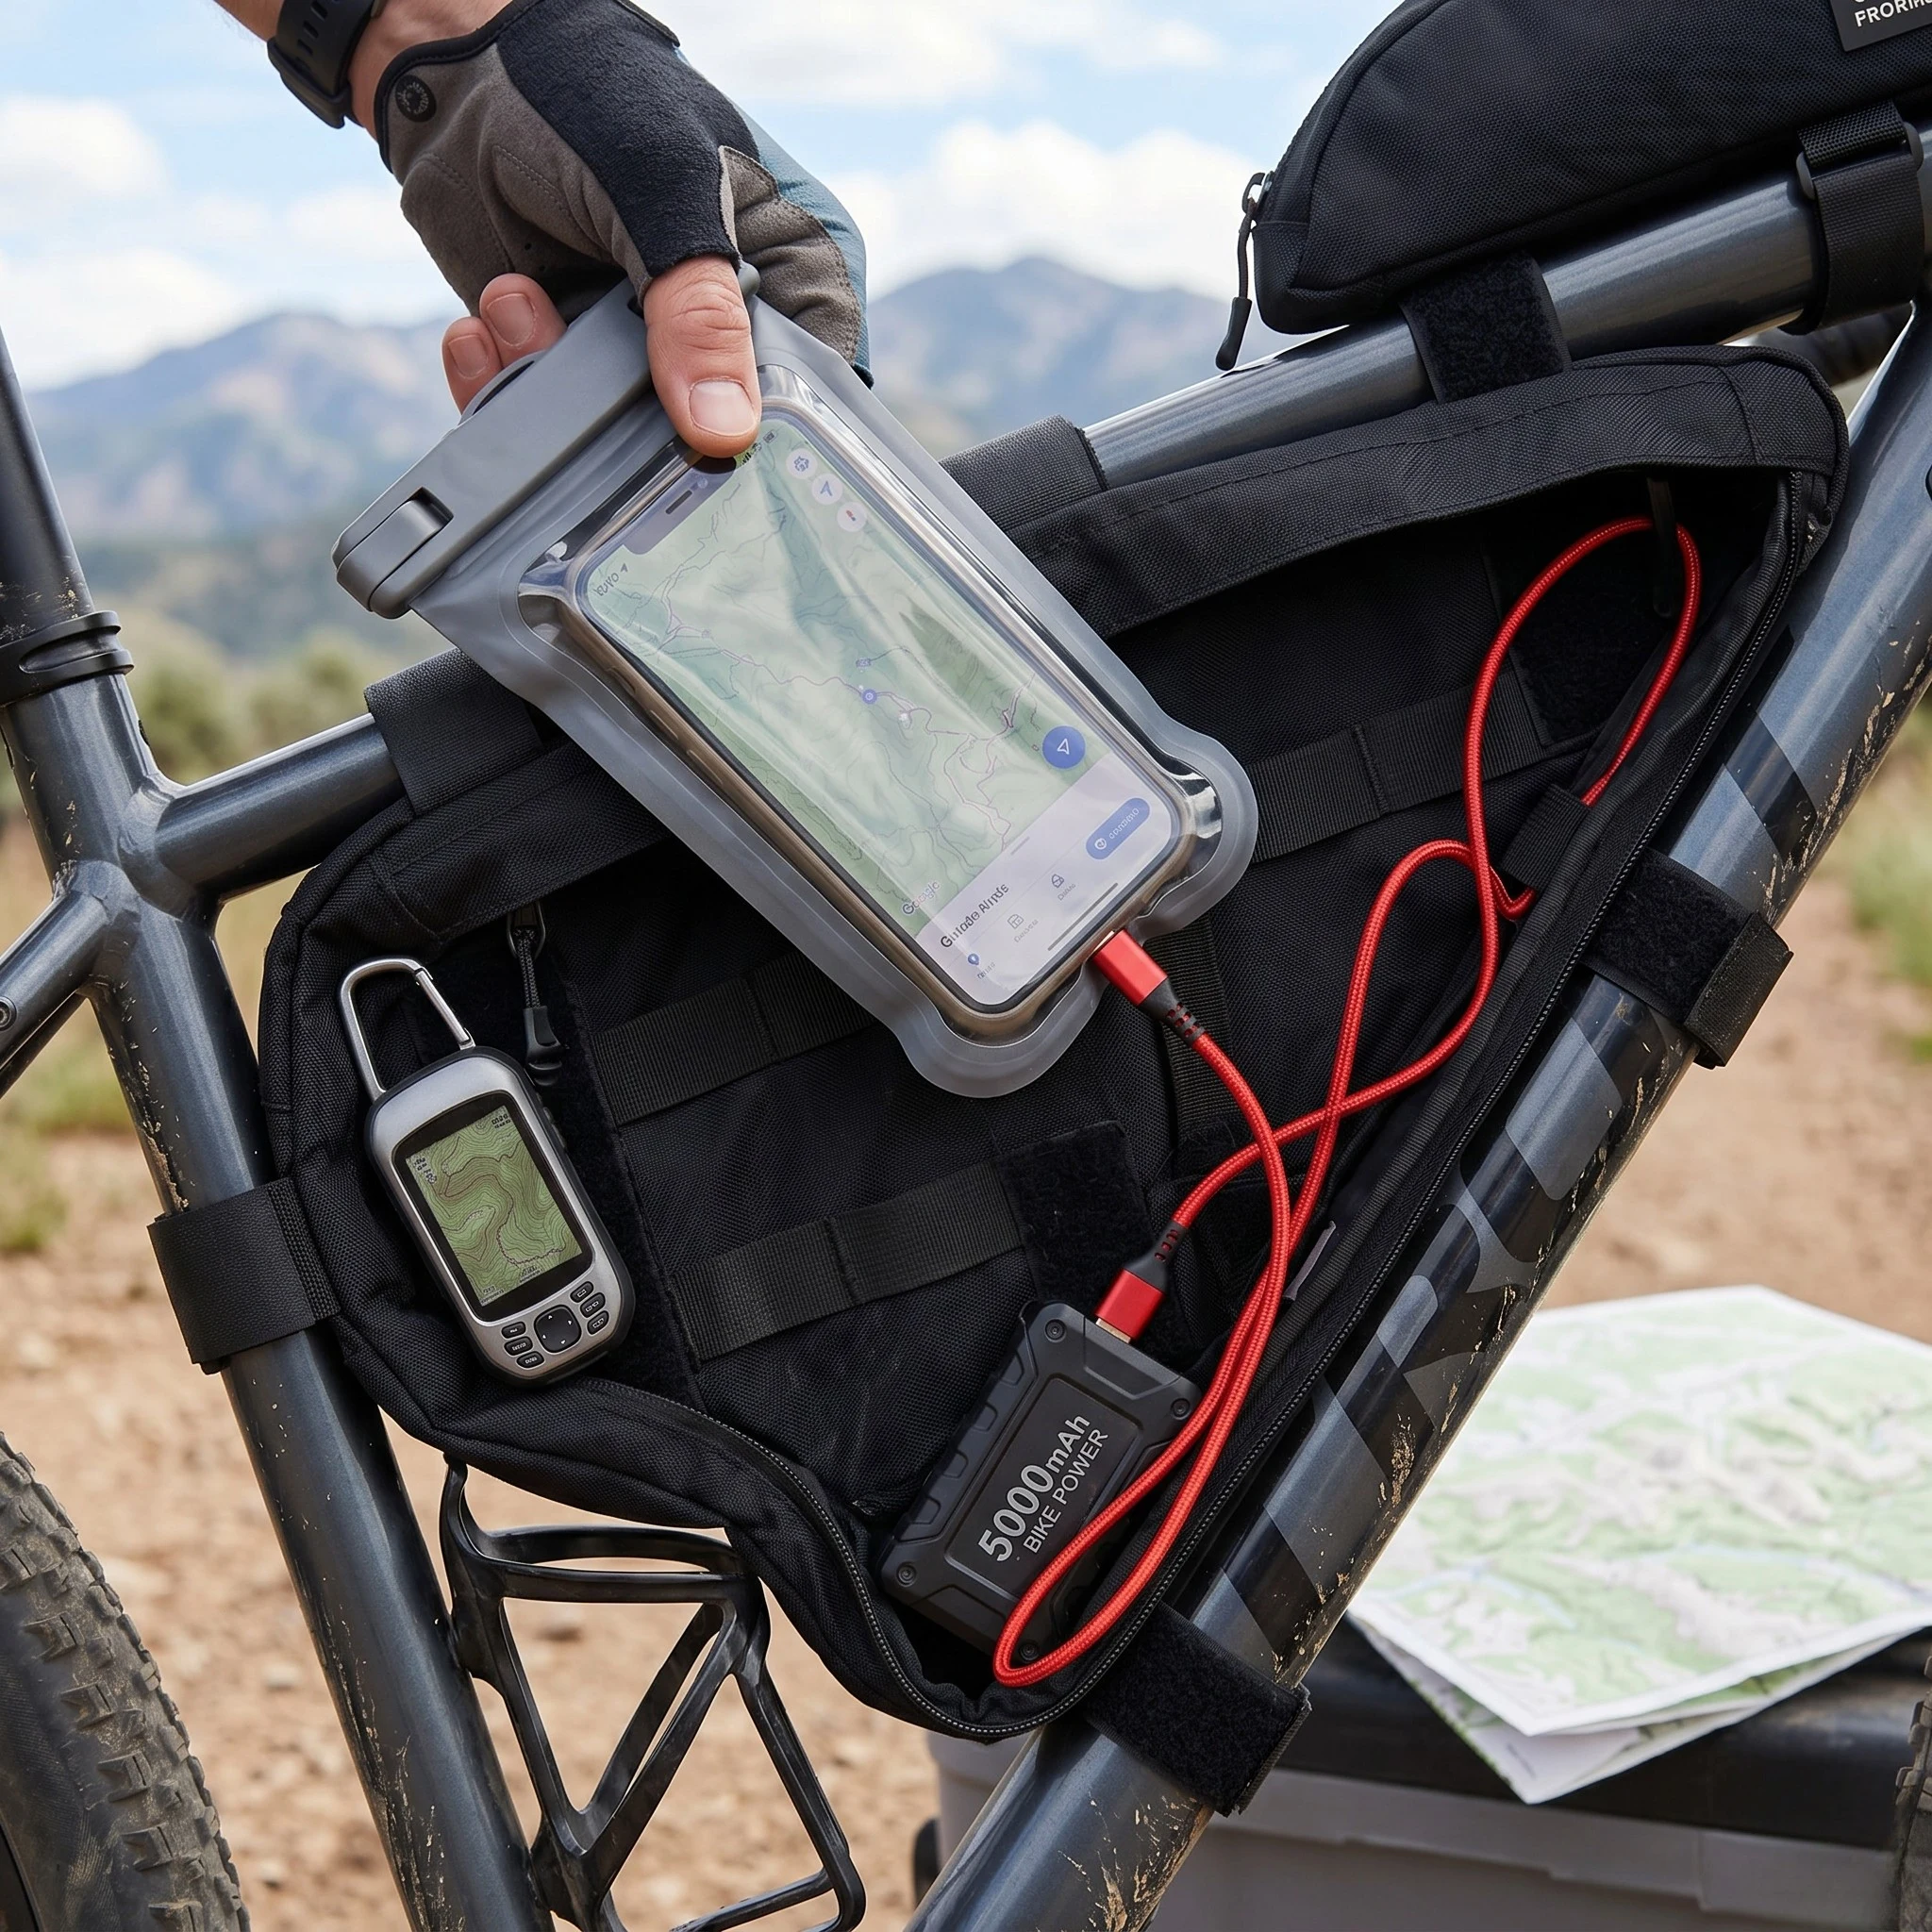
Preserving Battery via Power Management
Because continuous GPS tracking and data caching consume high amounts of energy, a redundant power supply is required. Carrying a high-capacity Anker PowerCore 737 (Affiliate Link) ensures that devices remain functional in Wet Weather Bikepacking conditions where solar charging is impossible.
- Offline Mode: Switch smartphones to Airplane Mode to prevent battery drain from searching for weak signals.
- Low Power Mode: Restrict background app refresh on all Off-Road Navigation applications.
- Backup Screens: Keep paper maps of the route corridor as a physical backup to digital systems.
8. Elite Hardware Integration: Satellite Communicators and Weather Meters
For true self-reliance, relying solely on cached smartphone data is insufficient. Integrating dedicated hardware provides real-time atmospheric measurements and satellite-linked forecasts when cellular networks are absent.
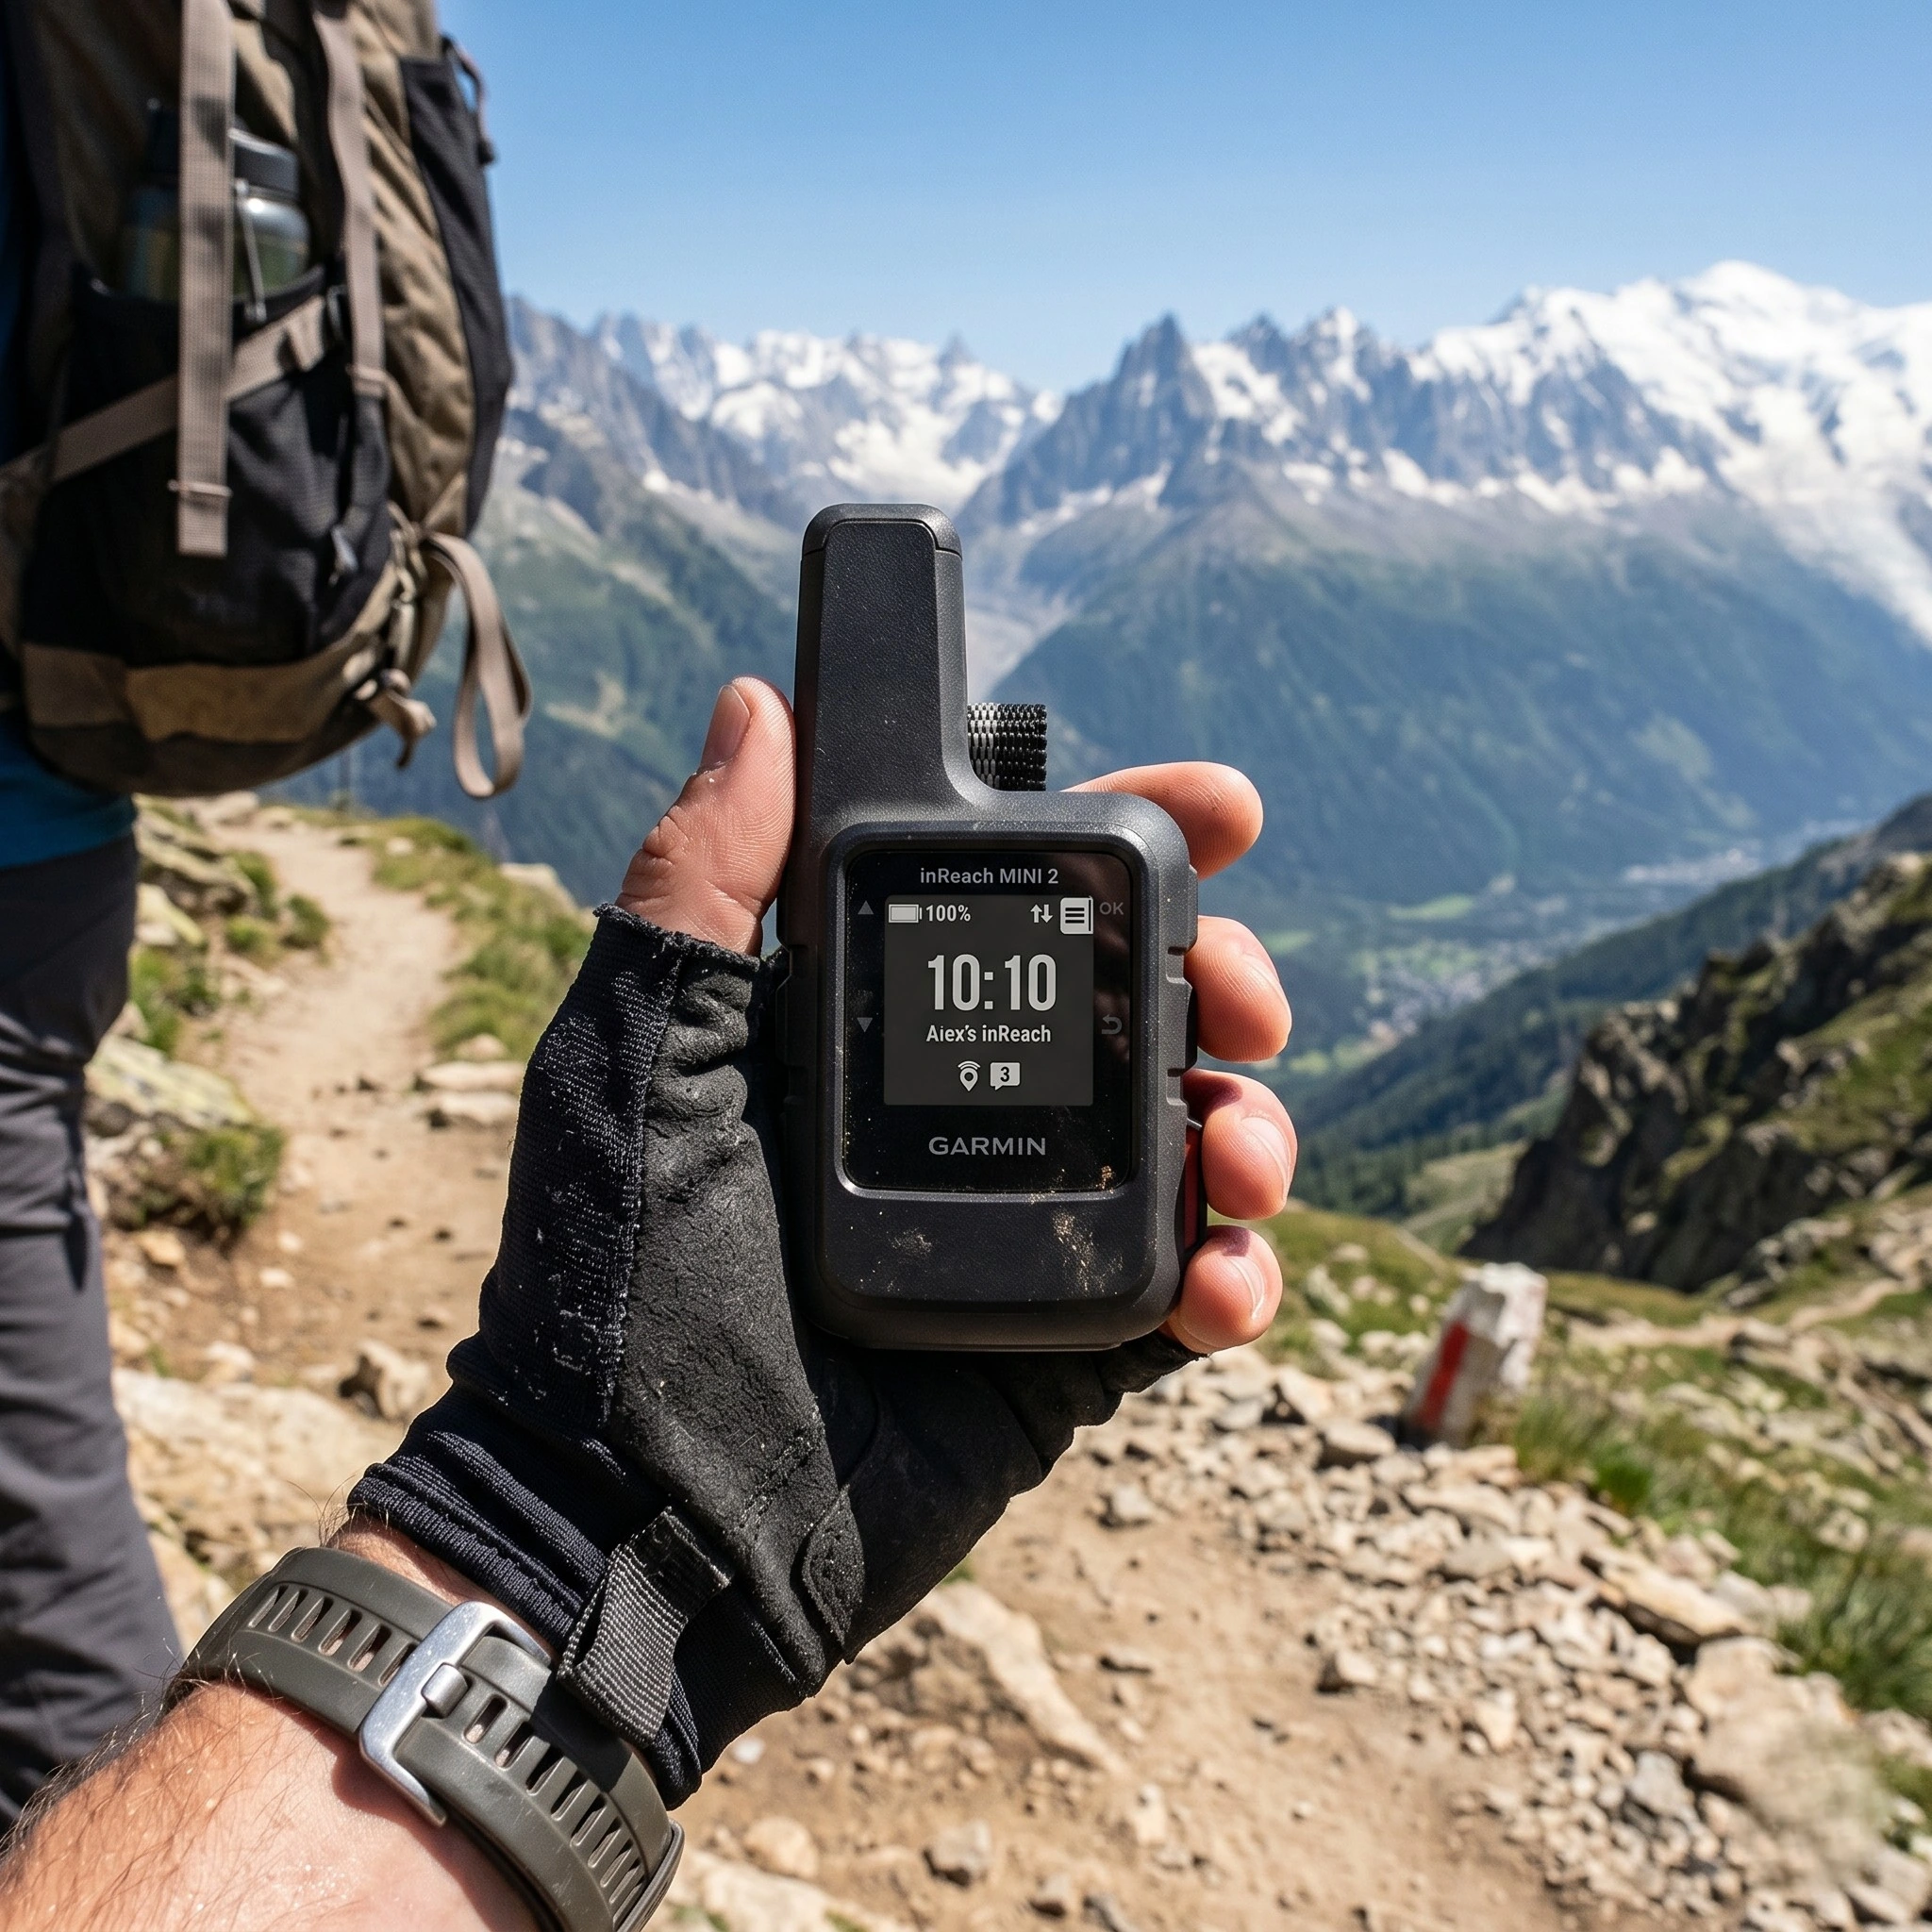
Garmin inReach Mini 2 (Satellite Lifeline)
A satellite communicator is a non-negotiable requirement for Solo Bikepacking Safety. It allows the user to request on-demand weather updates directly from global LEO networks, providing real-time barometric trends and precipitation warnings.
Key feature
Pros
Cons
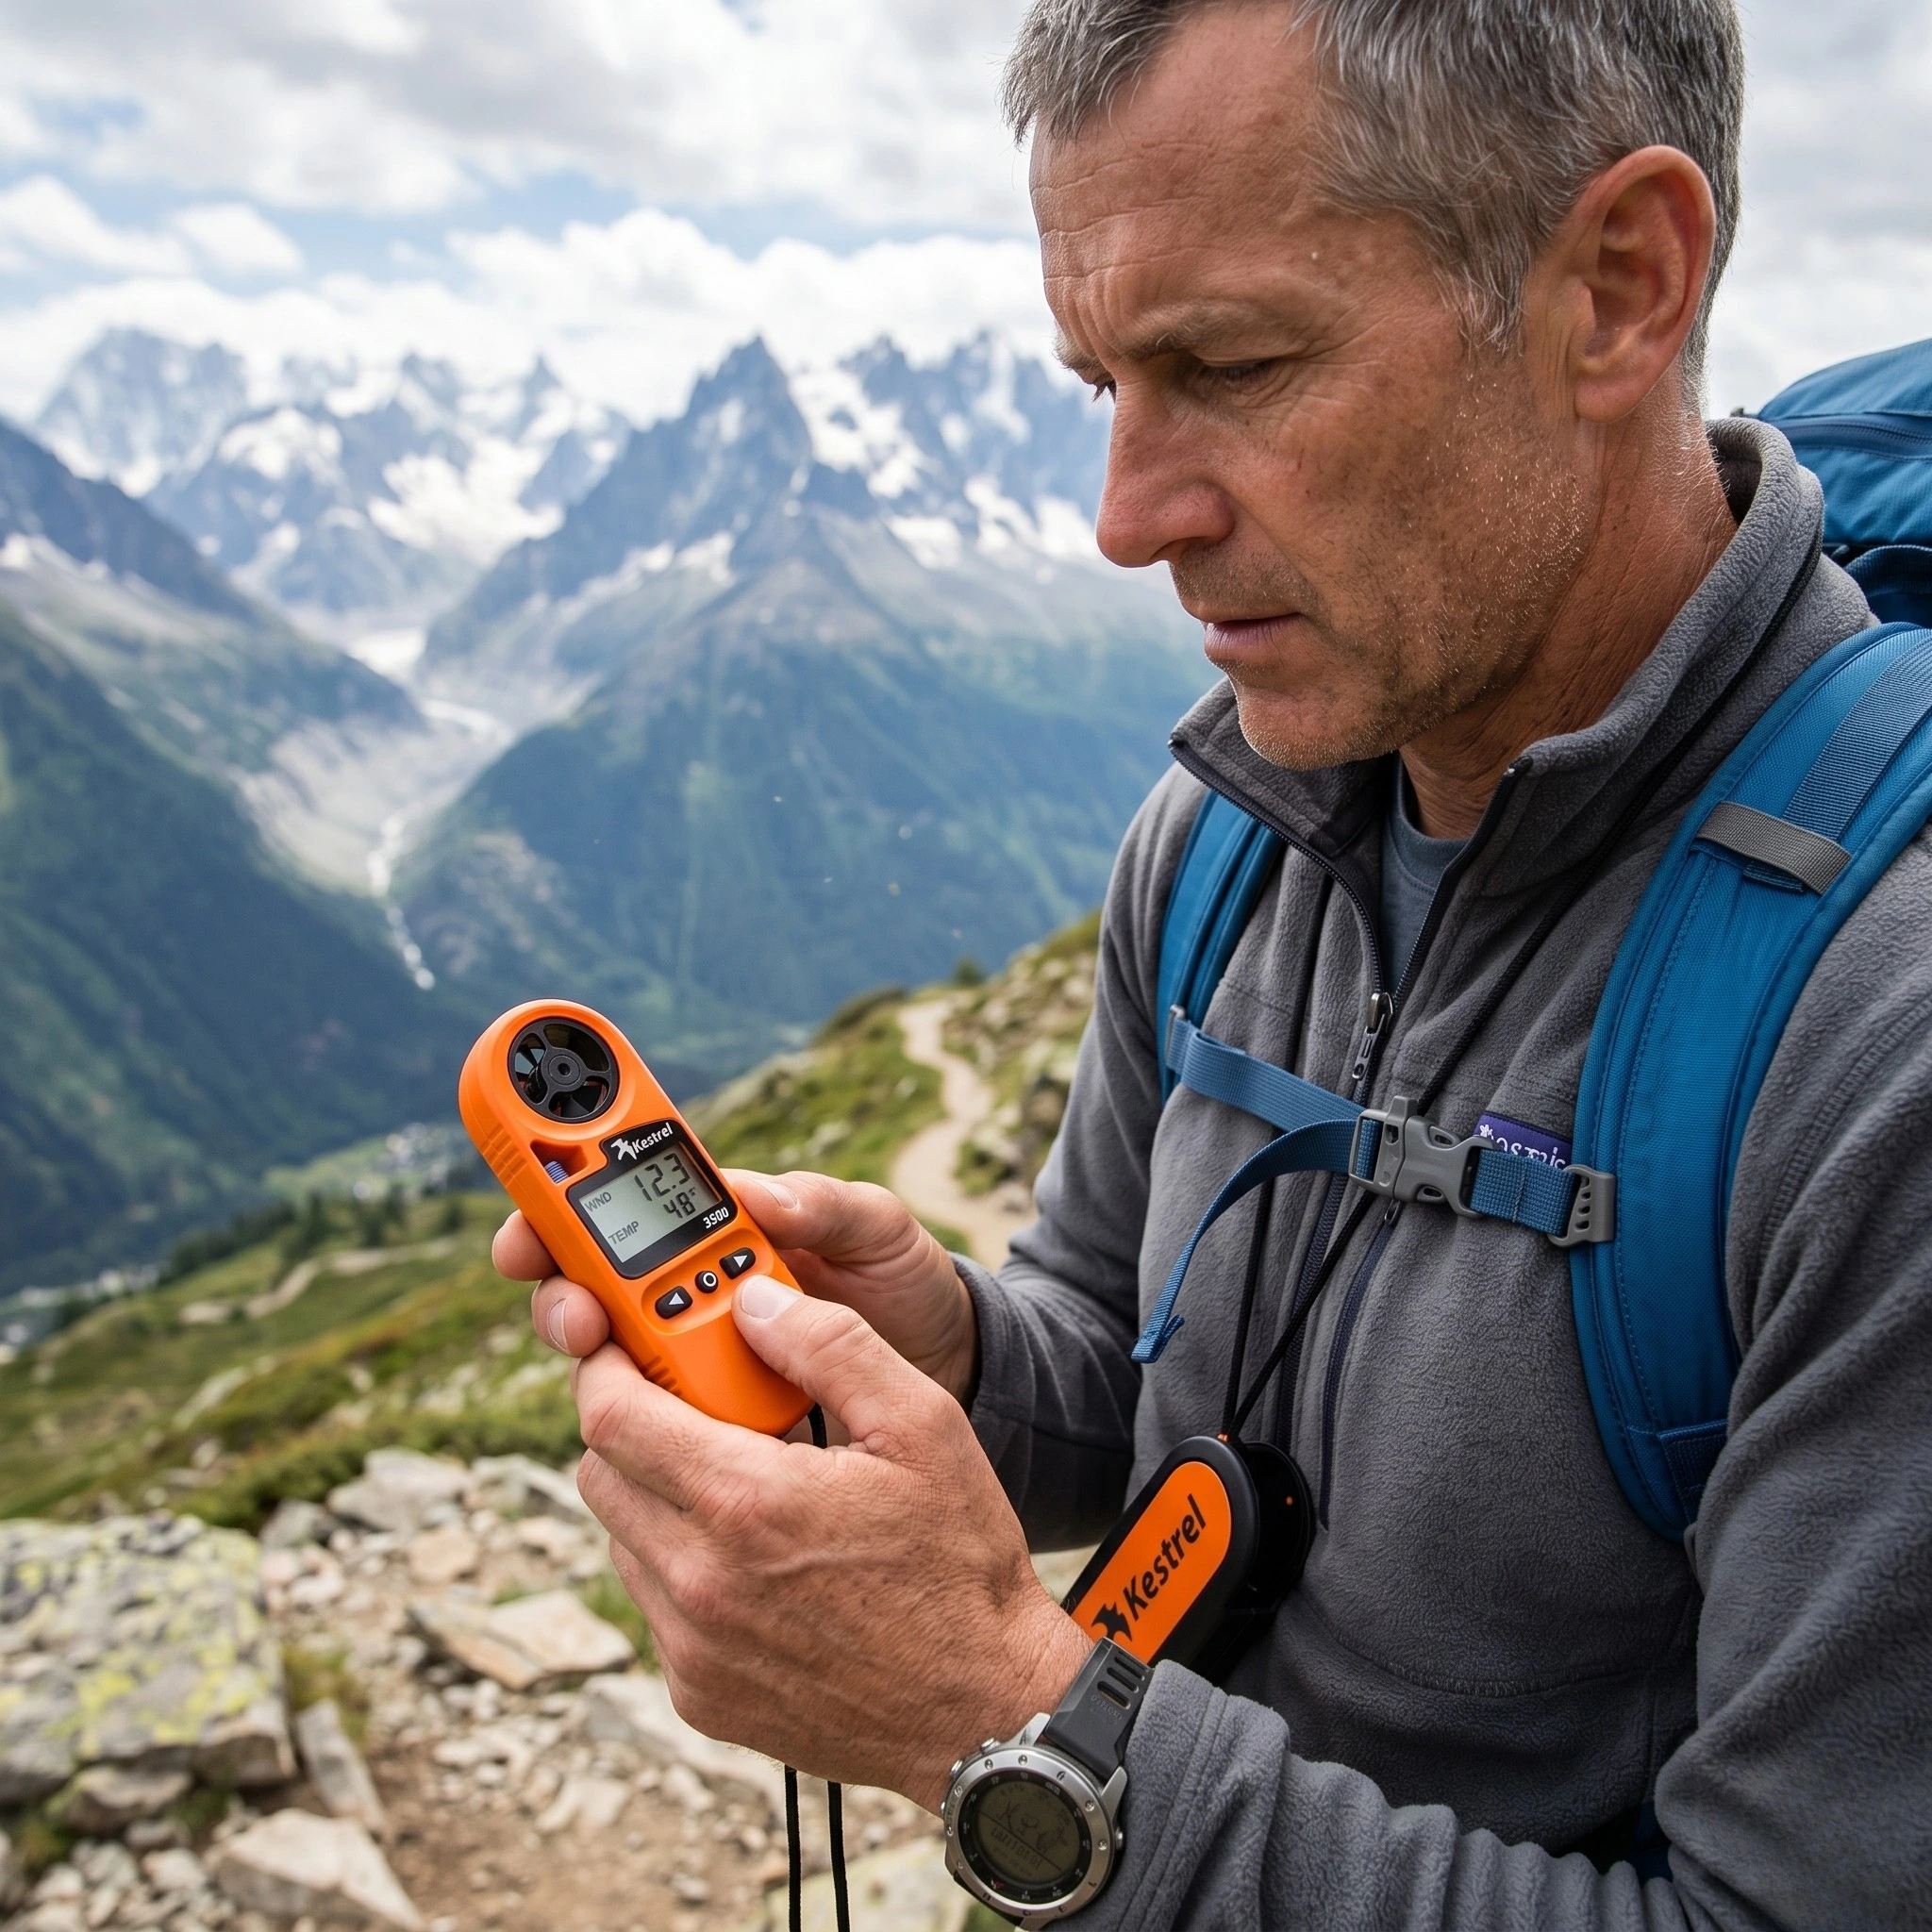
Kestrel 3500 Weather Meter (Tactical Environmental Monitoring)
To measure local weather changes in real time, the Kestrel 3500 Weather Meter (Affiliate Link) provides professional-grade measurements of wind speed, barometric pressure, relative humidity, and dew point.
Key feature
Pros
Cons
9. Environmental Risk Assessment and Mitigation Protocols
Once the navigator has gathered atmospheric data, they must implement a structured “Mitigation Protocol” to manage the risks of storm exposure. This is the operational layer of Soft Hiking and wilderness exploration.
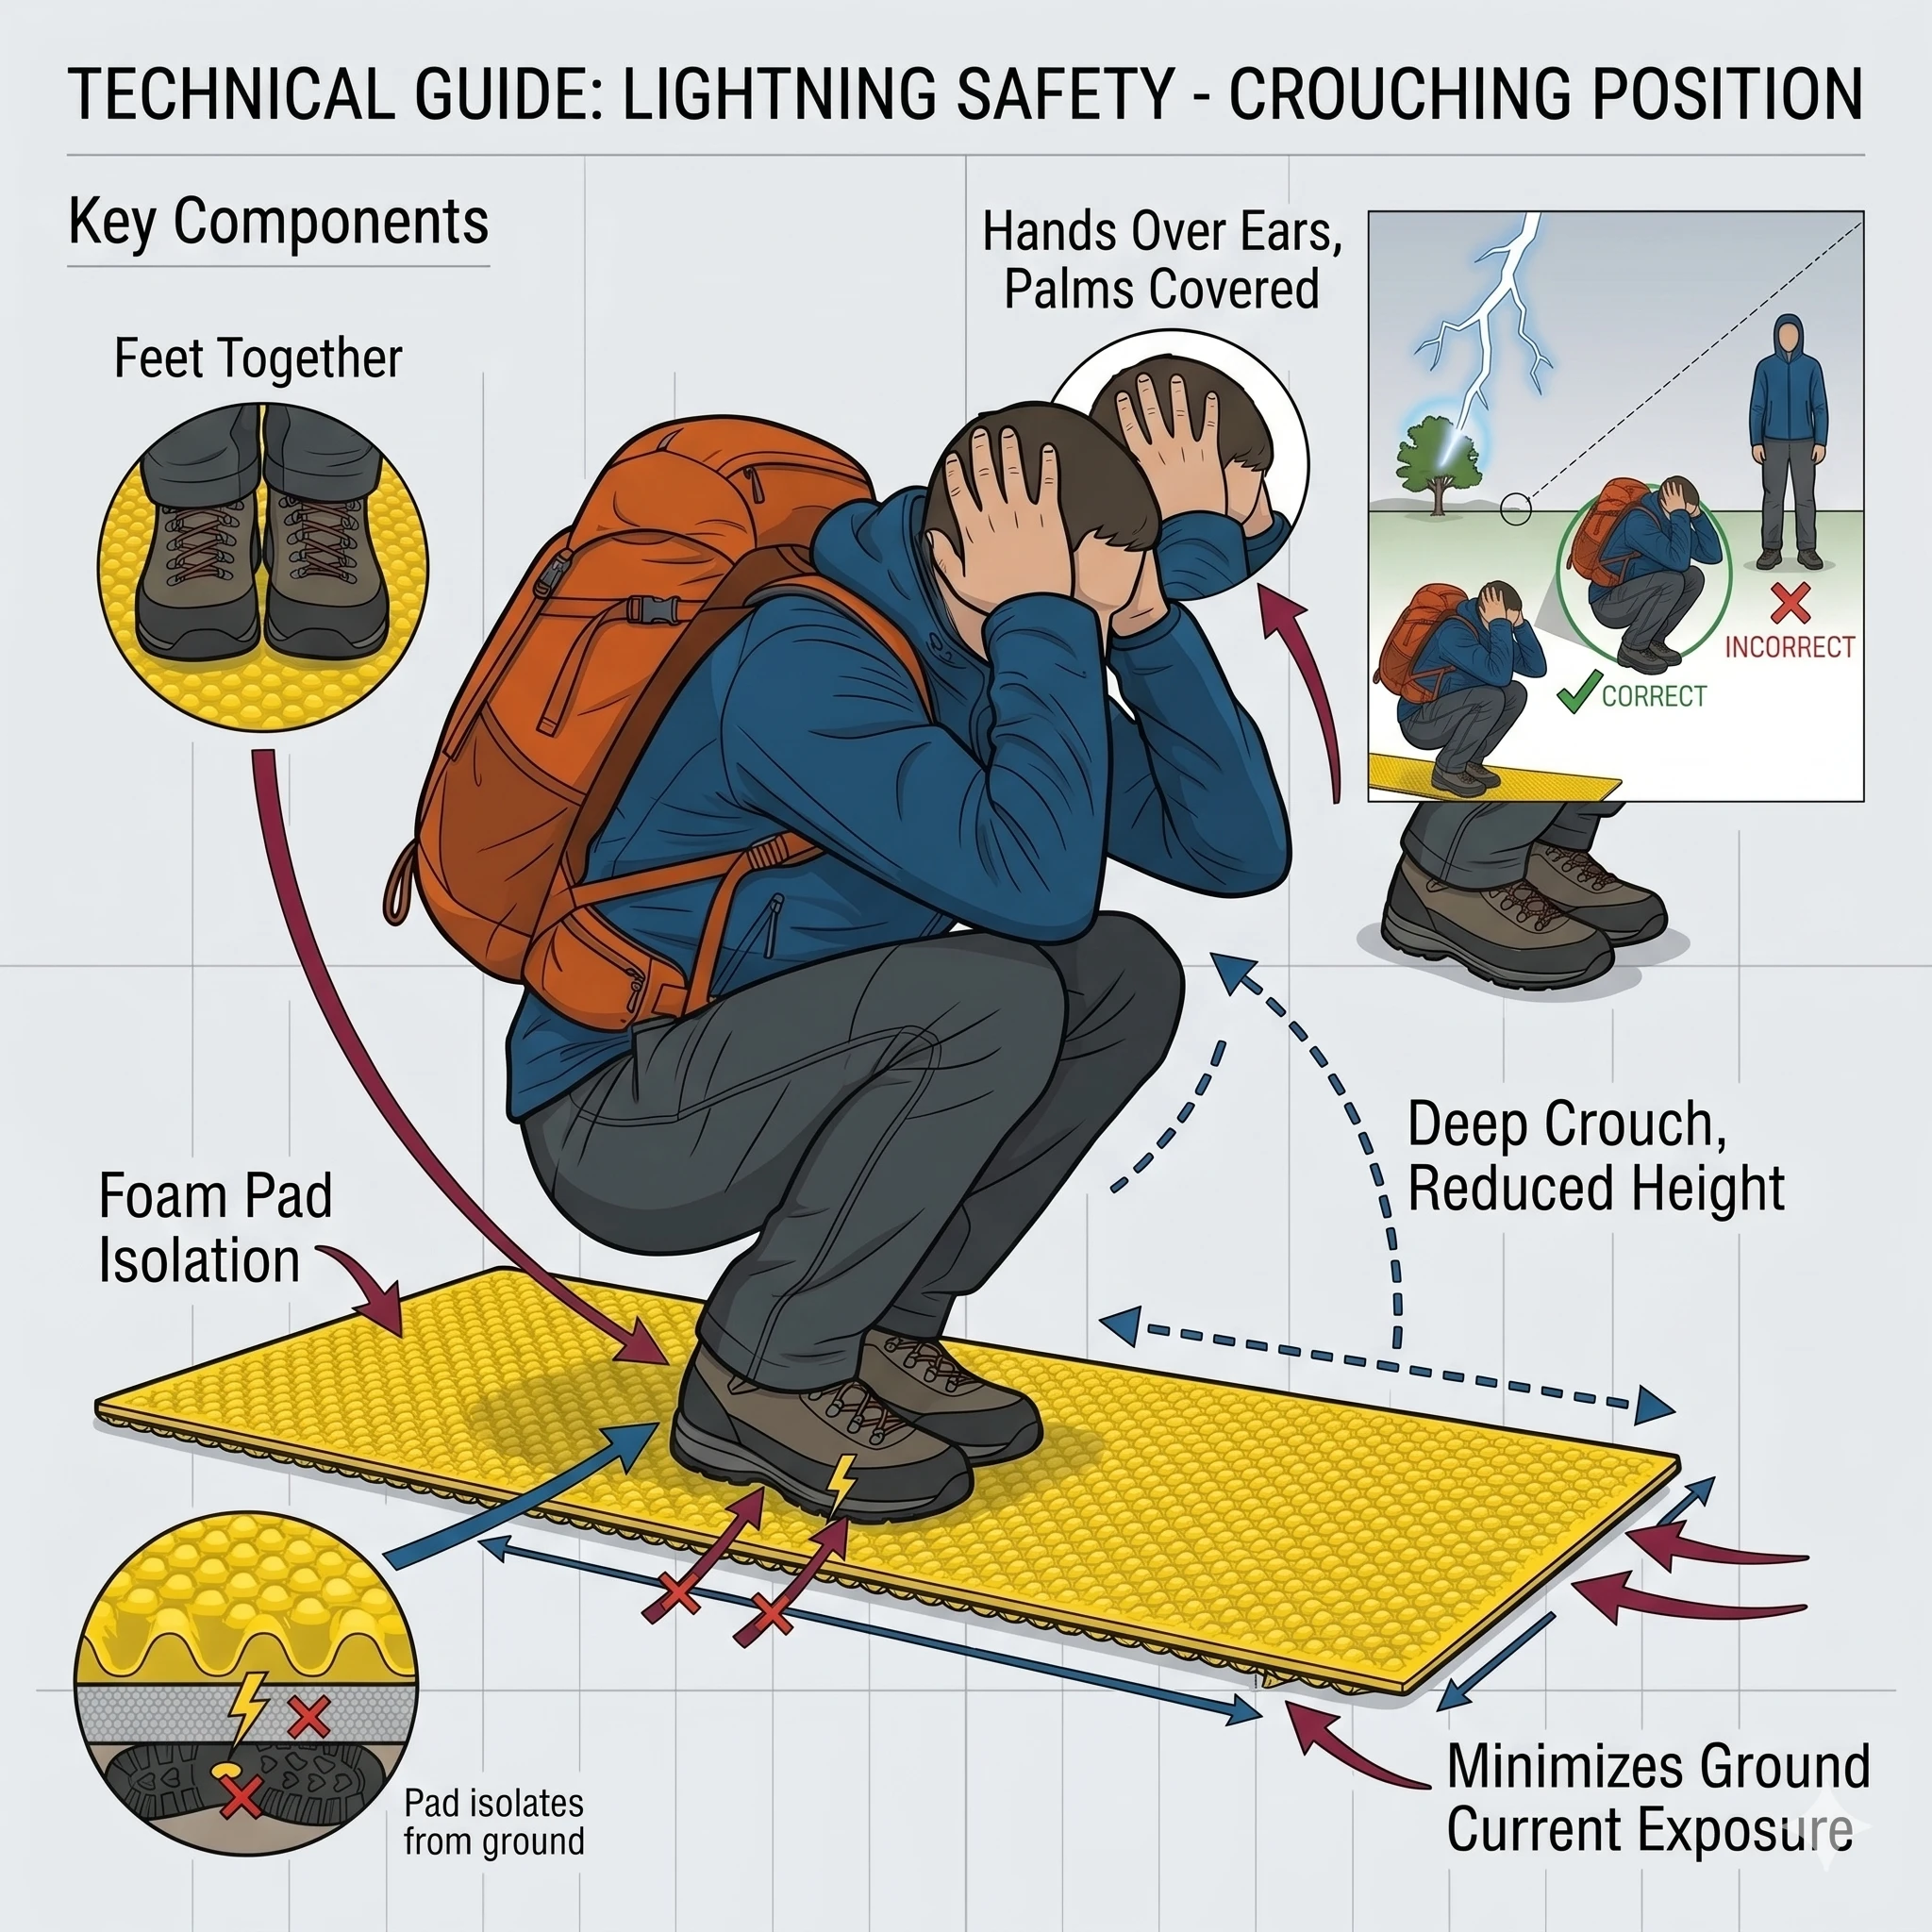
Lightning Safety Protocols
If the CAPE index on your app exceeds $1,000\text{ J/kg}$, convective development is highly likely. If caught above the tree line during a thunderstorm:
- Descend Immediately: Drop below the tree line to avoid becoming the tallest object on the ridge.
- Avoid Tall Objects: Do not seek shelter under isolated trees or rock overhangs.
- The Lightning Position: Crouch on a non-conductive surface (like a closed-cell foam sleeping pad) with feet together to minimize ground current exposure.
Flash Flood Mitigation
In narrow canyons or dry washes, heavy rain miles away can cause rapid, life-threatening flooding.
- Monitor Radar Vectoring: Check upstream drainage basins on your Satellite Messengers app.
- Establish High Camp: Never camp in a dry wash, even if the local sky is completely clear.
- Water Treatment Safety: High runoff increases sediment and biological pathogens; always filter water using a high-capacity Sawyer Squeeze Filter (Affiliate Link) to avoid waterborne illness.
Conclusion: Elevating Safety Through Data-Driven Navigation
Mastering the use of digital apps and atmospheric physics to predict trail weather is a transformative skill for any outdoor enthusiast. By understanding GFS vs. ECMWF models (Section 1), monitoring real-time barometric trends (Section 5), and integrating satellite communicators (Section 8), you remove the uncertainty of mountain travel. Safety is not a matter of luck; it is a matter of technical preparation and proactive risk mitigation.
Remember that no digital forecast can replace real-world observations. If your screen indicates clear skies but you observe dark, towering cumulus clouds on the horizon, trust the physical reality. Keep your Bikepacking Gear maintained and always carry a high-performance shell, like the Outdoor Research Helium Rain Jacket (Affiliate Link), to protect against sudden temperature drops.
The wilderness is waiting, and with the right data tools, you are ready to explore it safely. Treat the environment with respect, follow Leave No Trace Principles, and enjoy the unique liberation of off-road exploration. The transition from a casual hiker to a seasoned backcountry navigator is a path paved with preparation. Step out with a plan, respect your physical limits, and embrace the unparalleled power of data-driven safety.
Discover more from Maive Verse
Subscribe to get the latest posts sent to your email.