
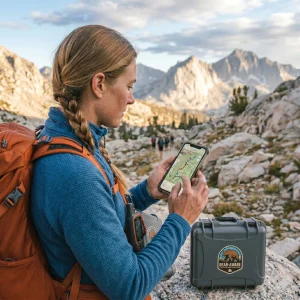

Master microclimate forecasting with modern satellite apps. Learn GFS vs. ECMWF models, barometric tracking, and radar loops for safe wilderness navigation.
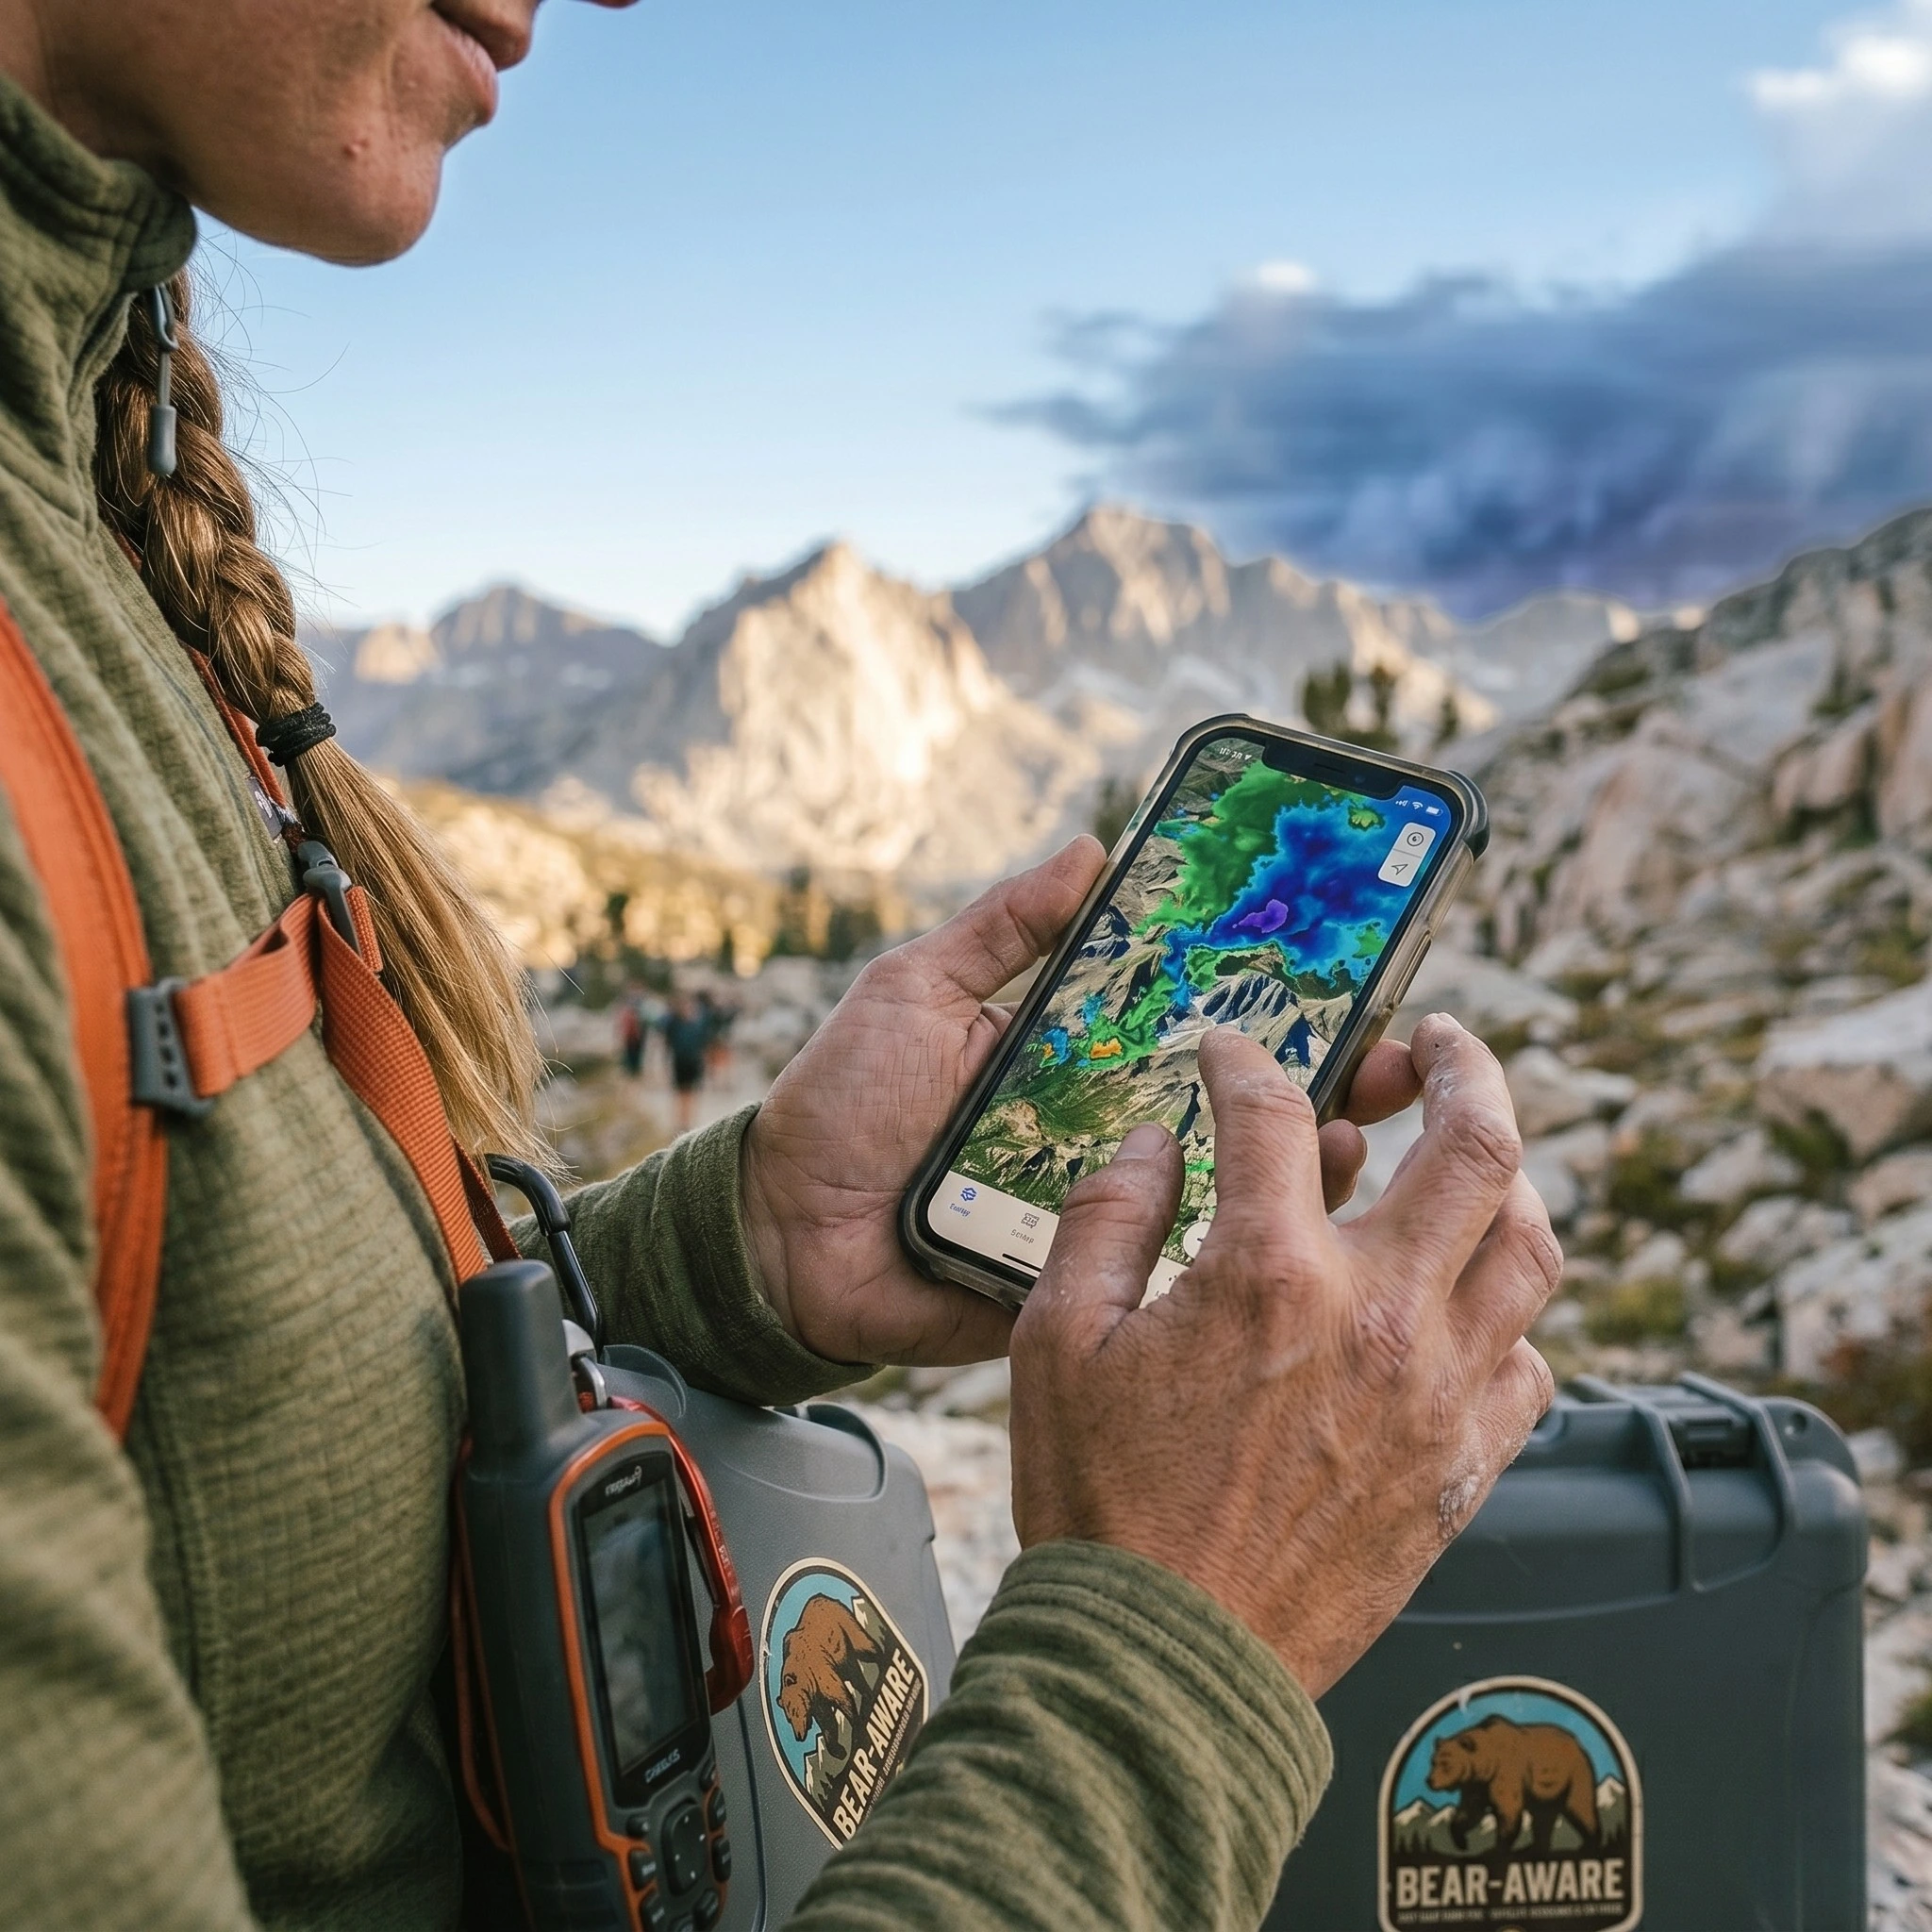
Table of Contents
Introduction: The Atmospheric Reality of Wilderness Travel
Developing a system to predict trail weather is a foundational safety protocol for any self-contained outdoor expedition. In remote mountain corridors, weather is not merely an inconvenience; it is a dynamic hazard capable of altering trail conditions within minutes. For those who have already completed the Bikepacking for Beginners transition, mastering microclimate forecasting is the next phase in achieving complete trail autonomy. Relying solely on a static, pre-departure regional forecast is insufficient when navigating complex topographic structures.
The primary objective of advanced weather tracking is the prevention of exposure-related emergencies. When utilizing digital tools for Off-Road Navigation, understanding the physical mechanisms behind barometric drift, wind shear, and convective development is paramount. An prepared navigator treats atmospheric data with the same precision as trail coordinates. This guide provides a technical analysis of how to read global forecasting models, interpret satellite overlays, and configure hardware to maintain safety on remote Bikepacking Routes.
1. Understanding Meteorological Models: GFS vs. ECMWF
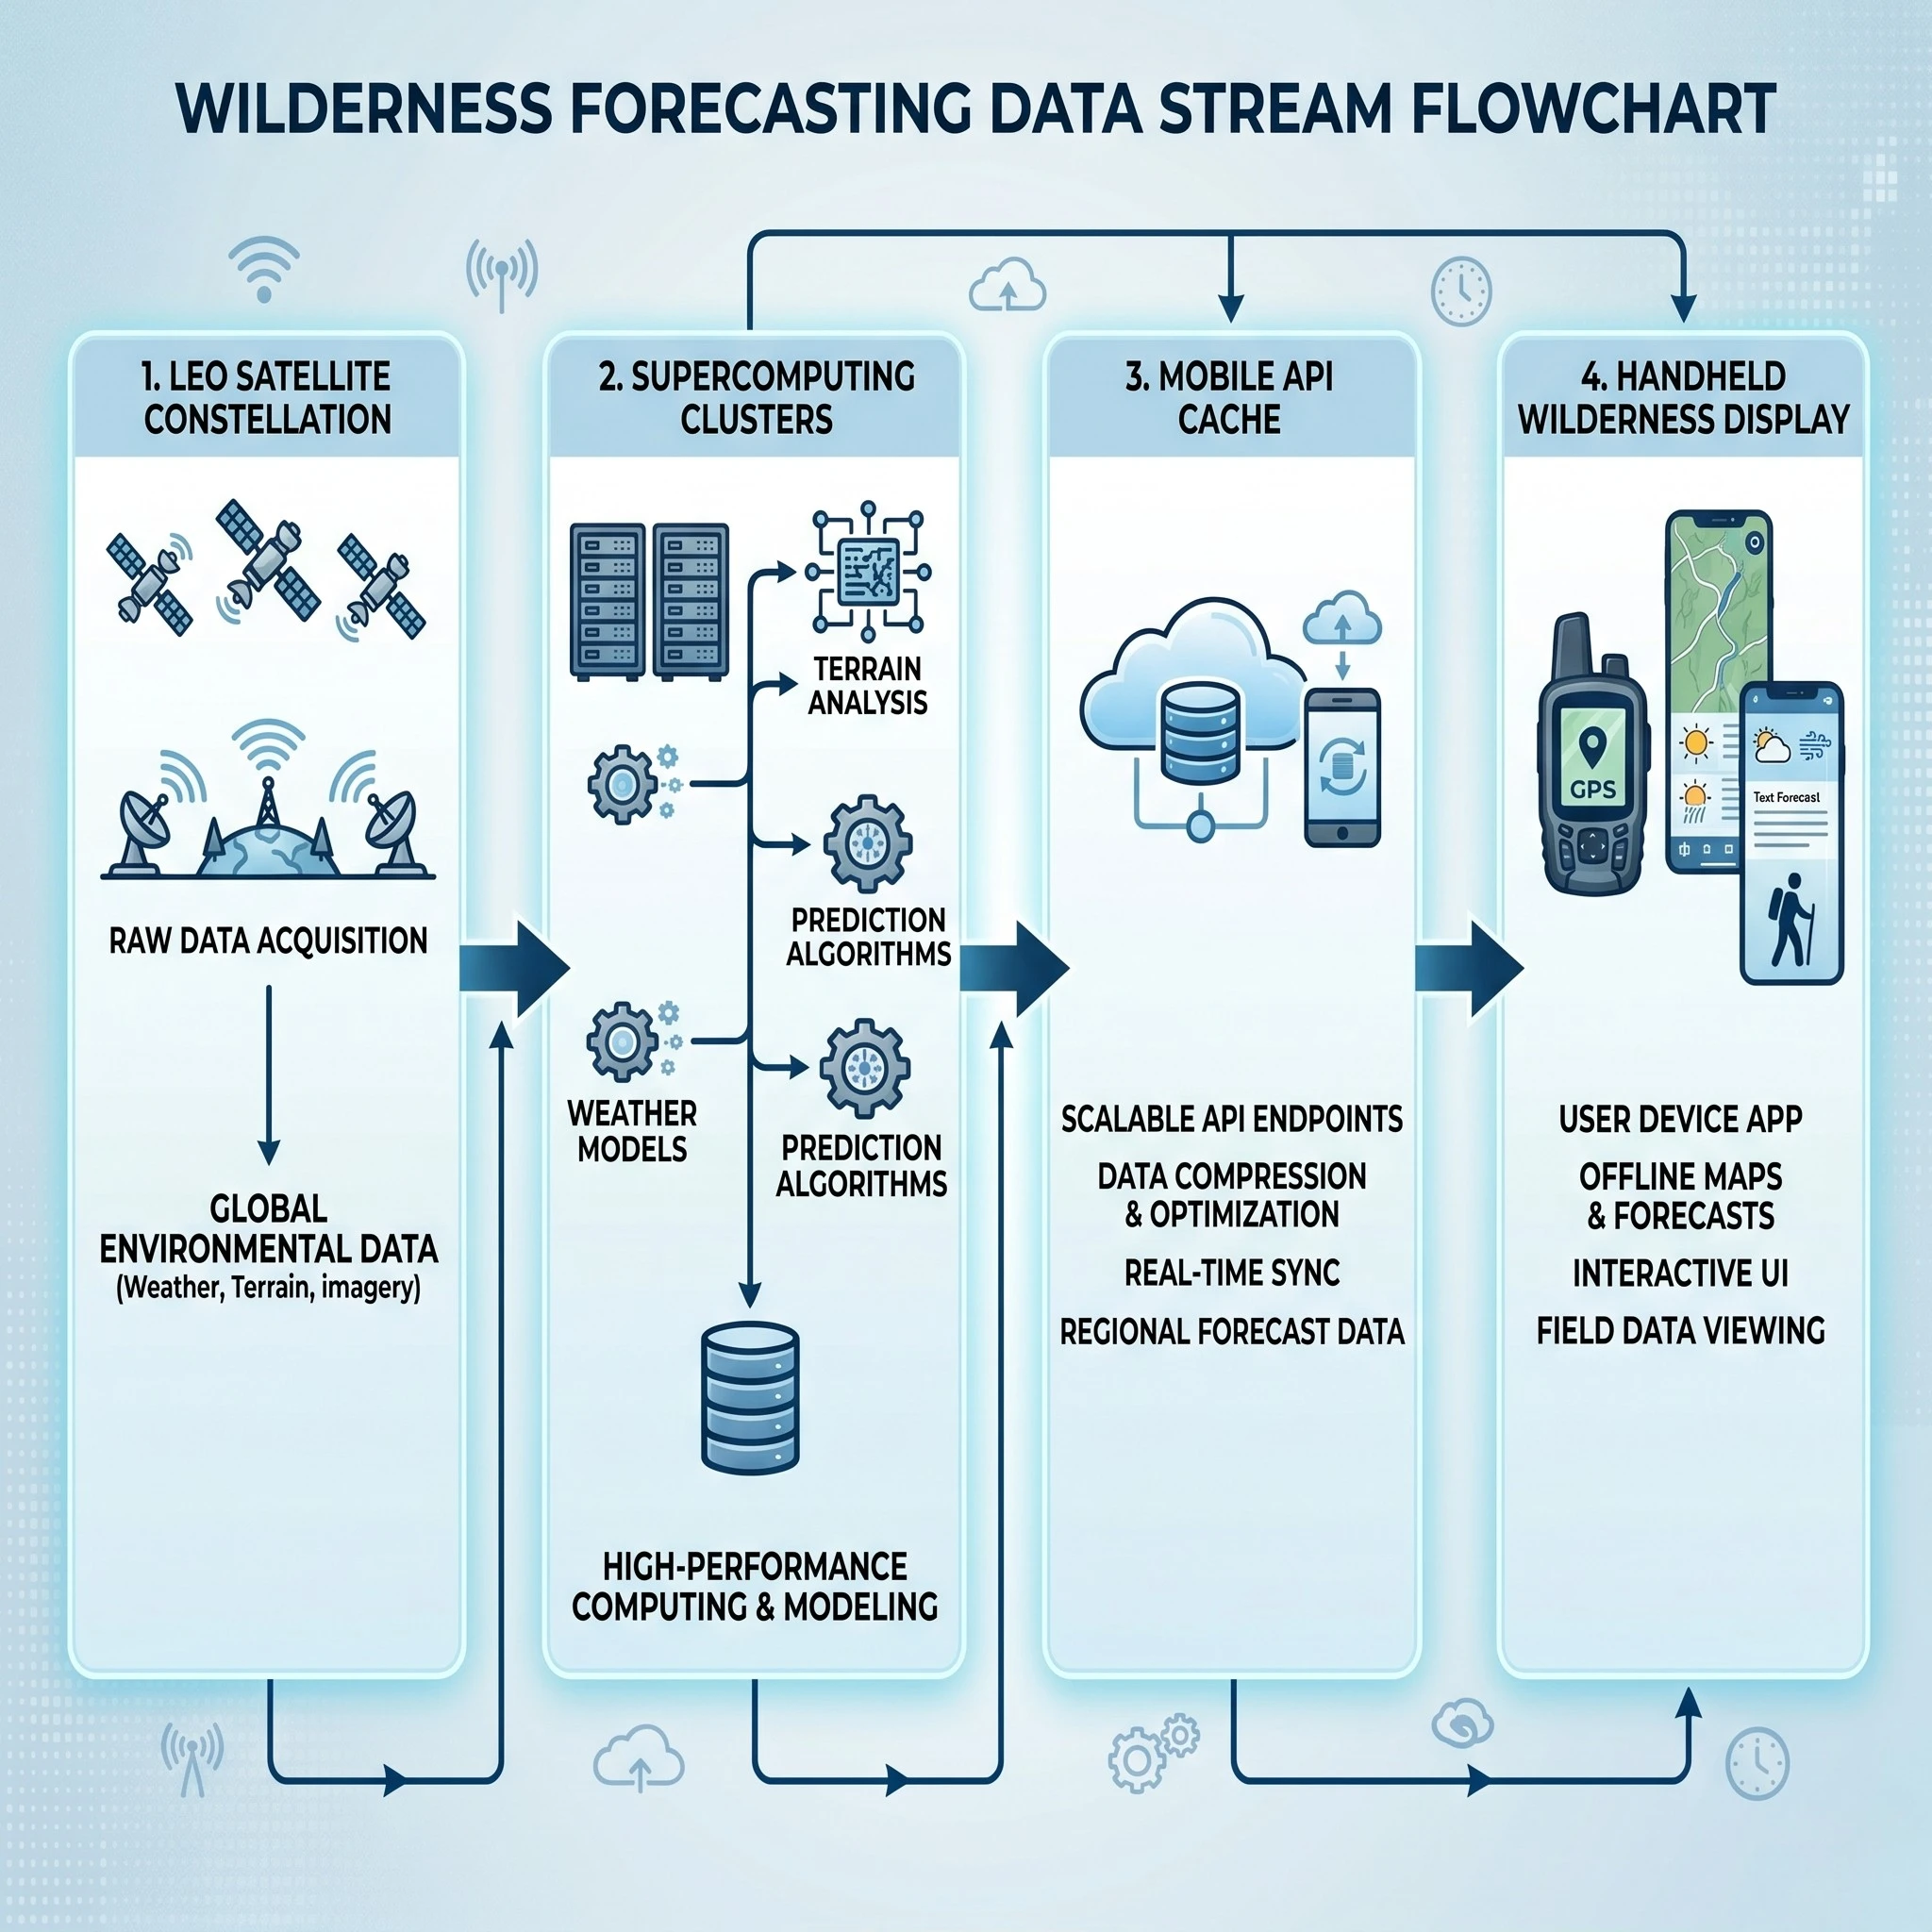
To accurately predict trail weather, one must understand the distinct mathematical frameworks that generate digital forecasts. Mobile weather applications do not create their own data; instead, they display outputs from global numerical weather prediction (NWP) models. The two most prominent models are the Global Forecast System (GFS) and the European Centre for Medium-Range Weather Forecasts (ECMWF).
The Global Forecast System (GFS)
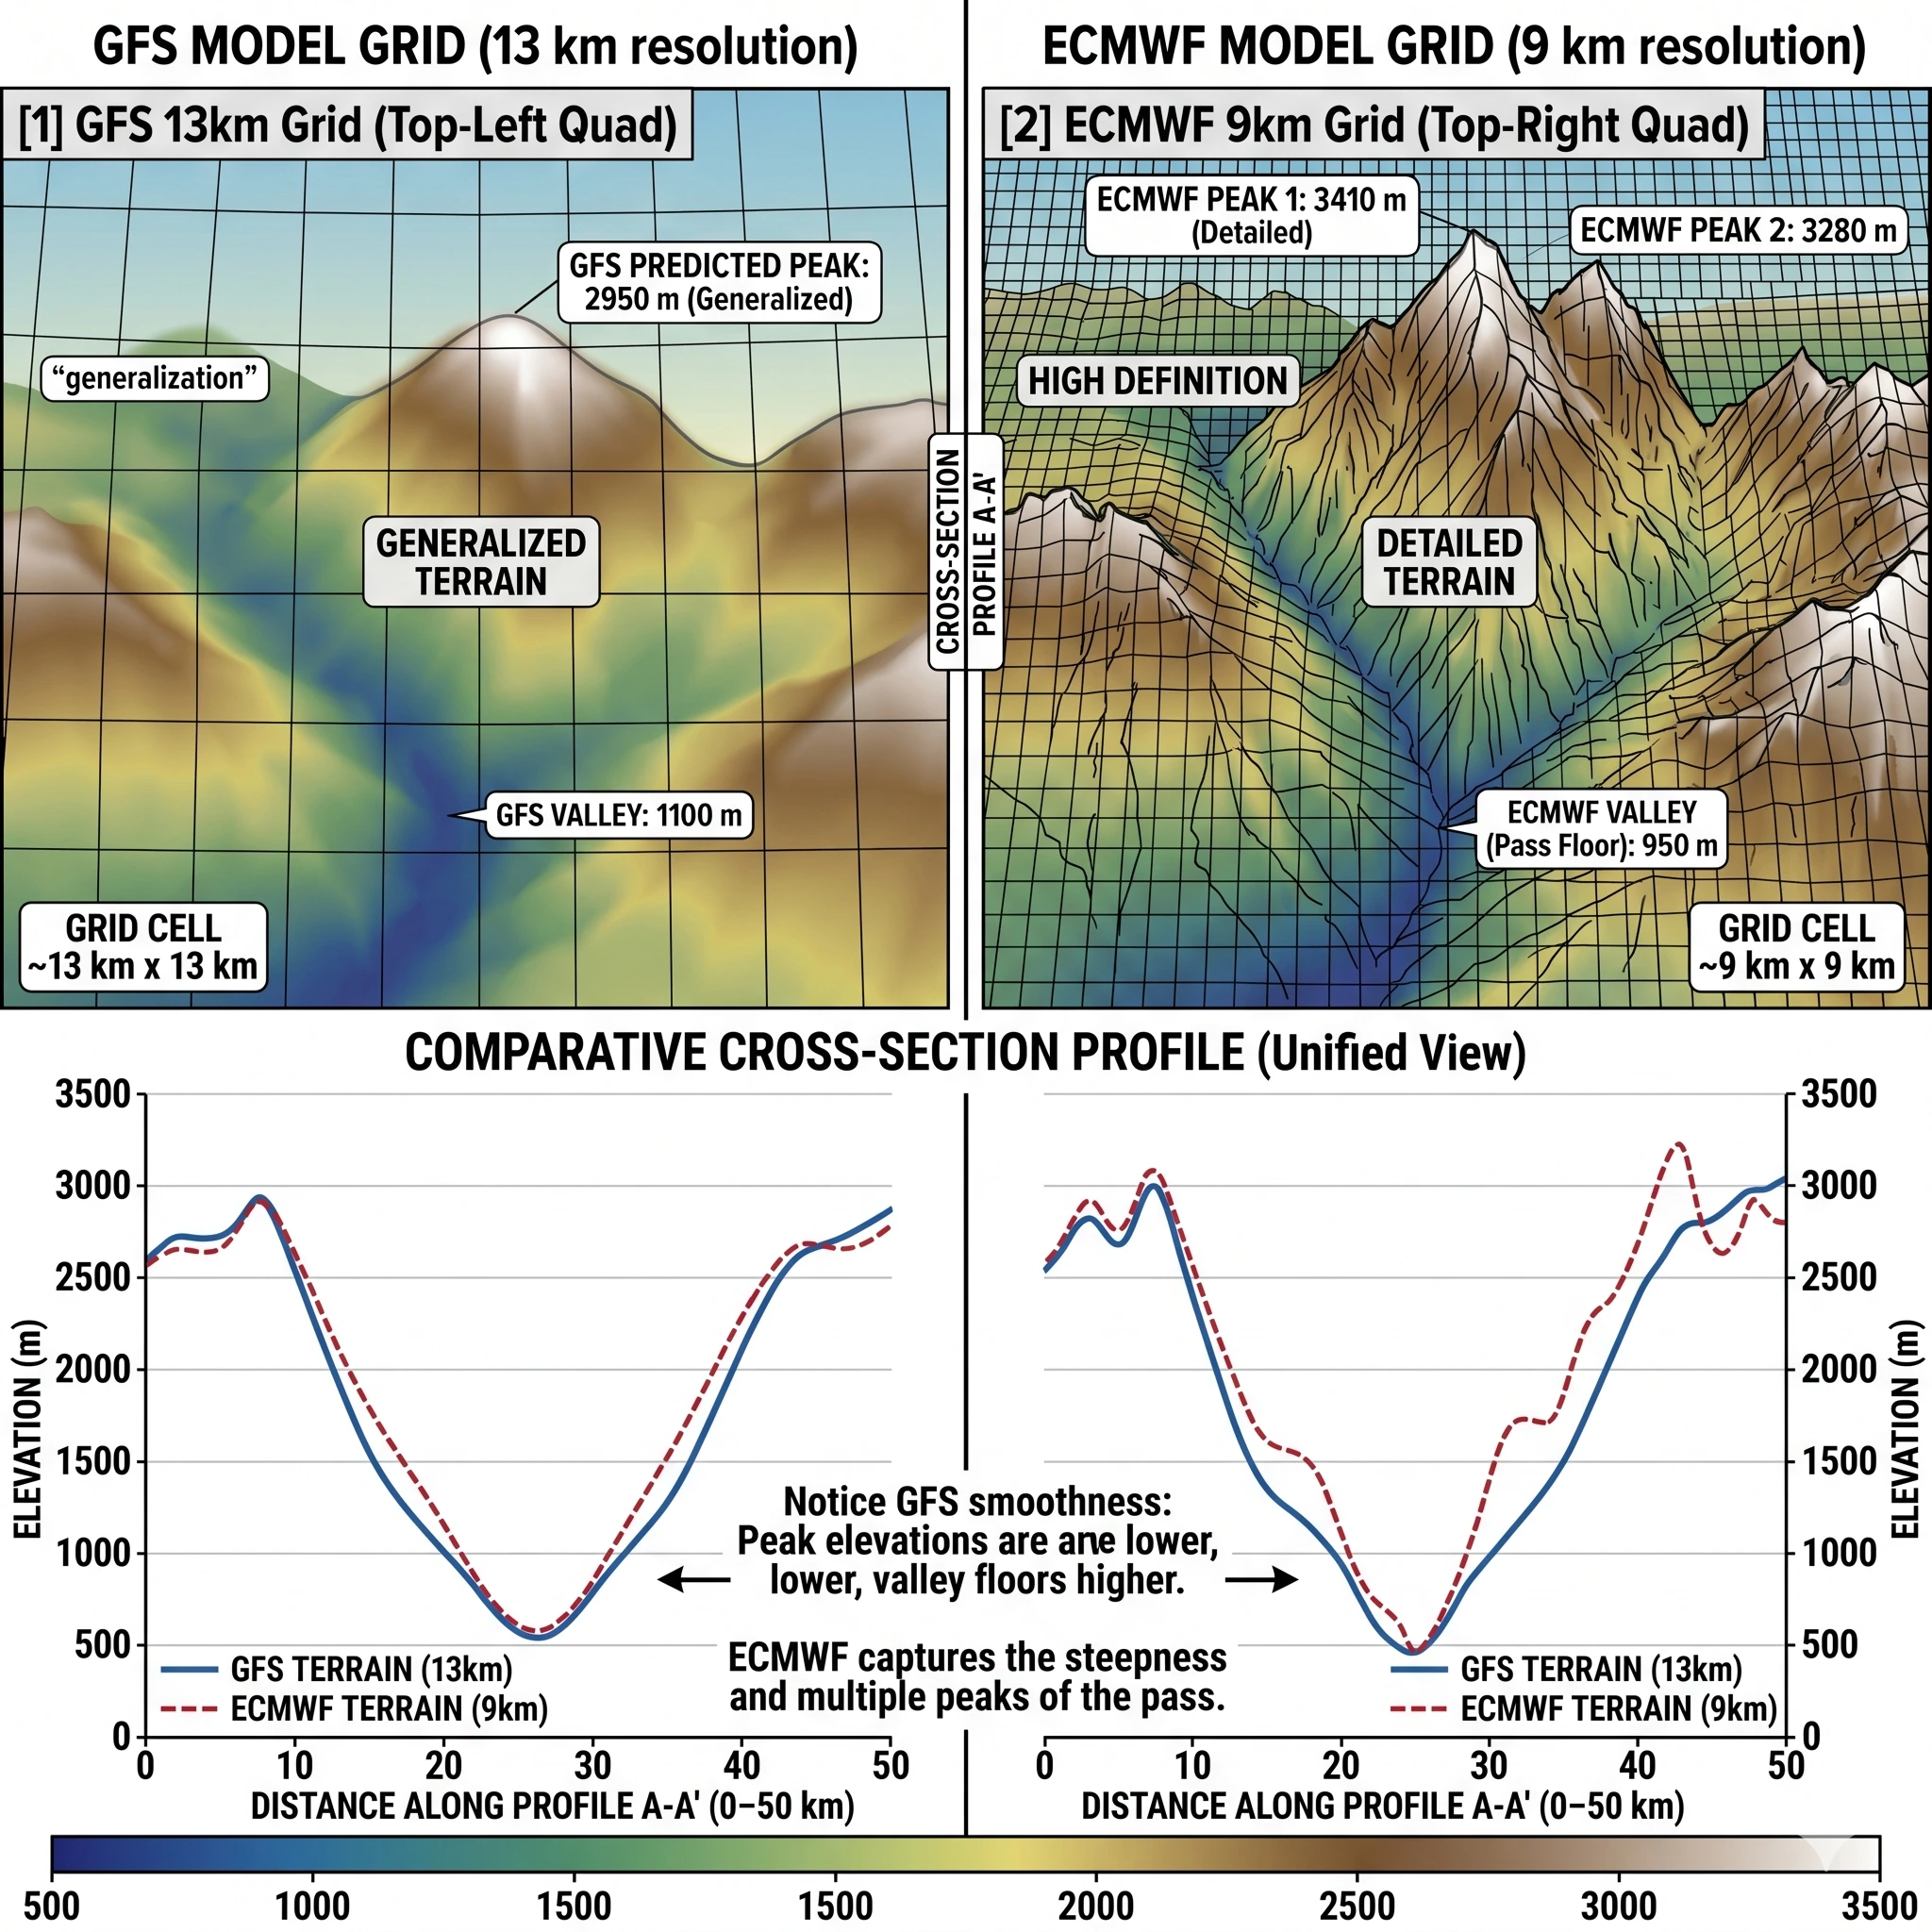
Managed by the NOAA Weather Monitoring agency, the GFS is a free, open-access model updated four times daily. It operates on a horizontal grid resolution of approximately 13 kilometers. While highly reliable for macro-scale storm tracking, its wider grid spacing can struggle to resolve localized mountain valleys and thermal anomalies.
The European Model (ECMWF)
The ECMWF Meteorological Data model is widely considered the gold standard for mid-range forecasting, operating on a high-resolution 9-kilometer grid. This tighter resolution provides superior accuracy when predicting orographic precipitation and temperature inversions along complex slopes. Most premium apps require a subscription to access raw ECMWF data, which is a highly recommended investment for remote wilderness travel.
2. Mastering Real-Time Radar Interpretation
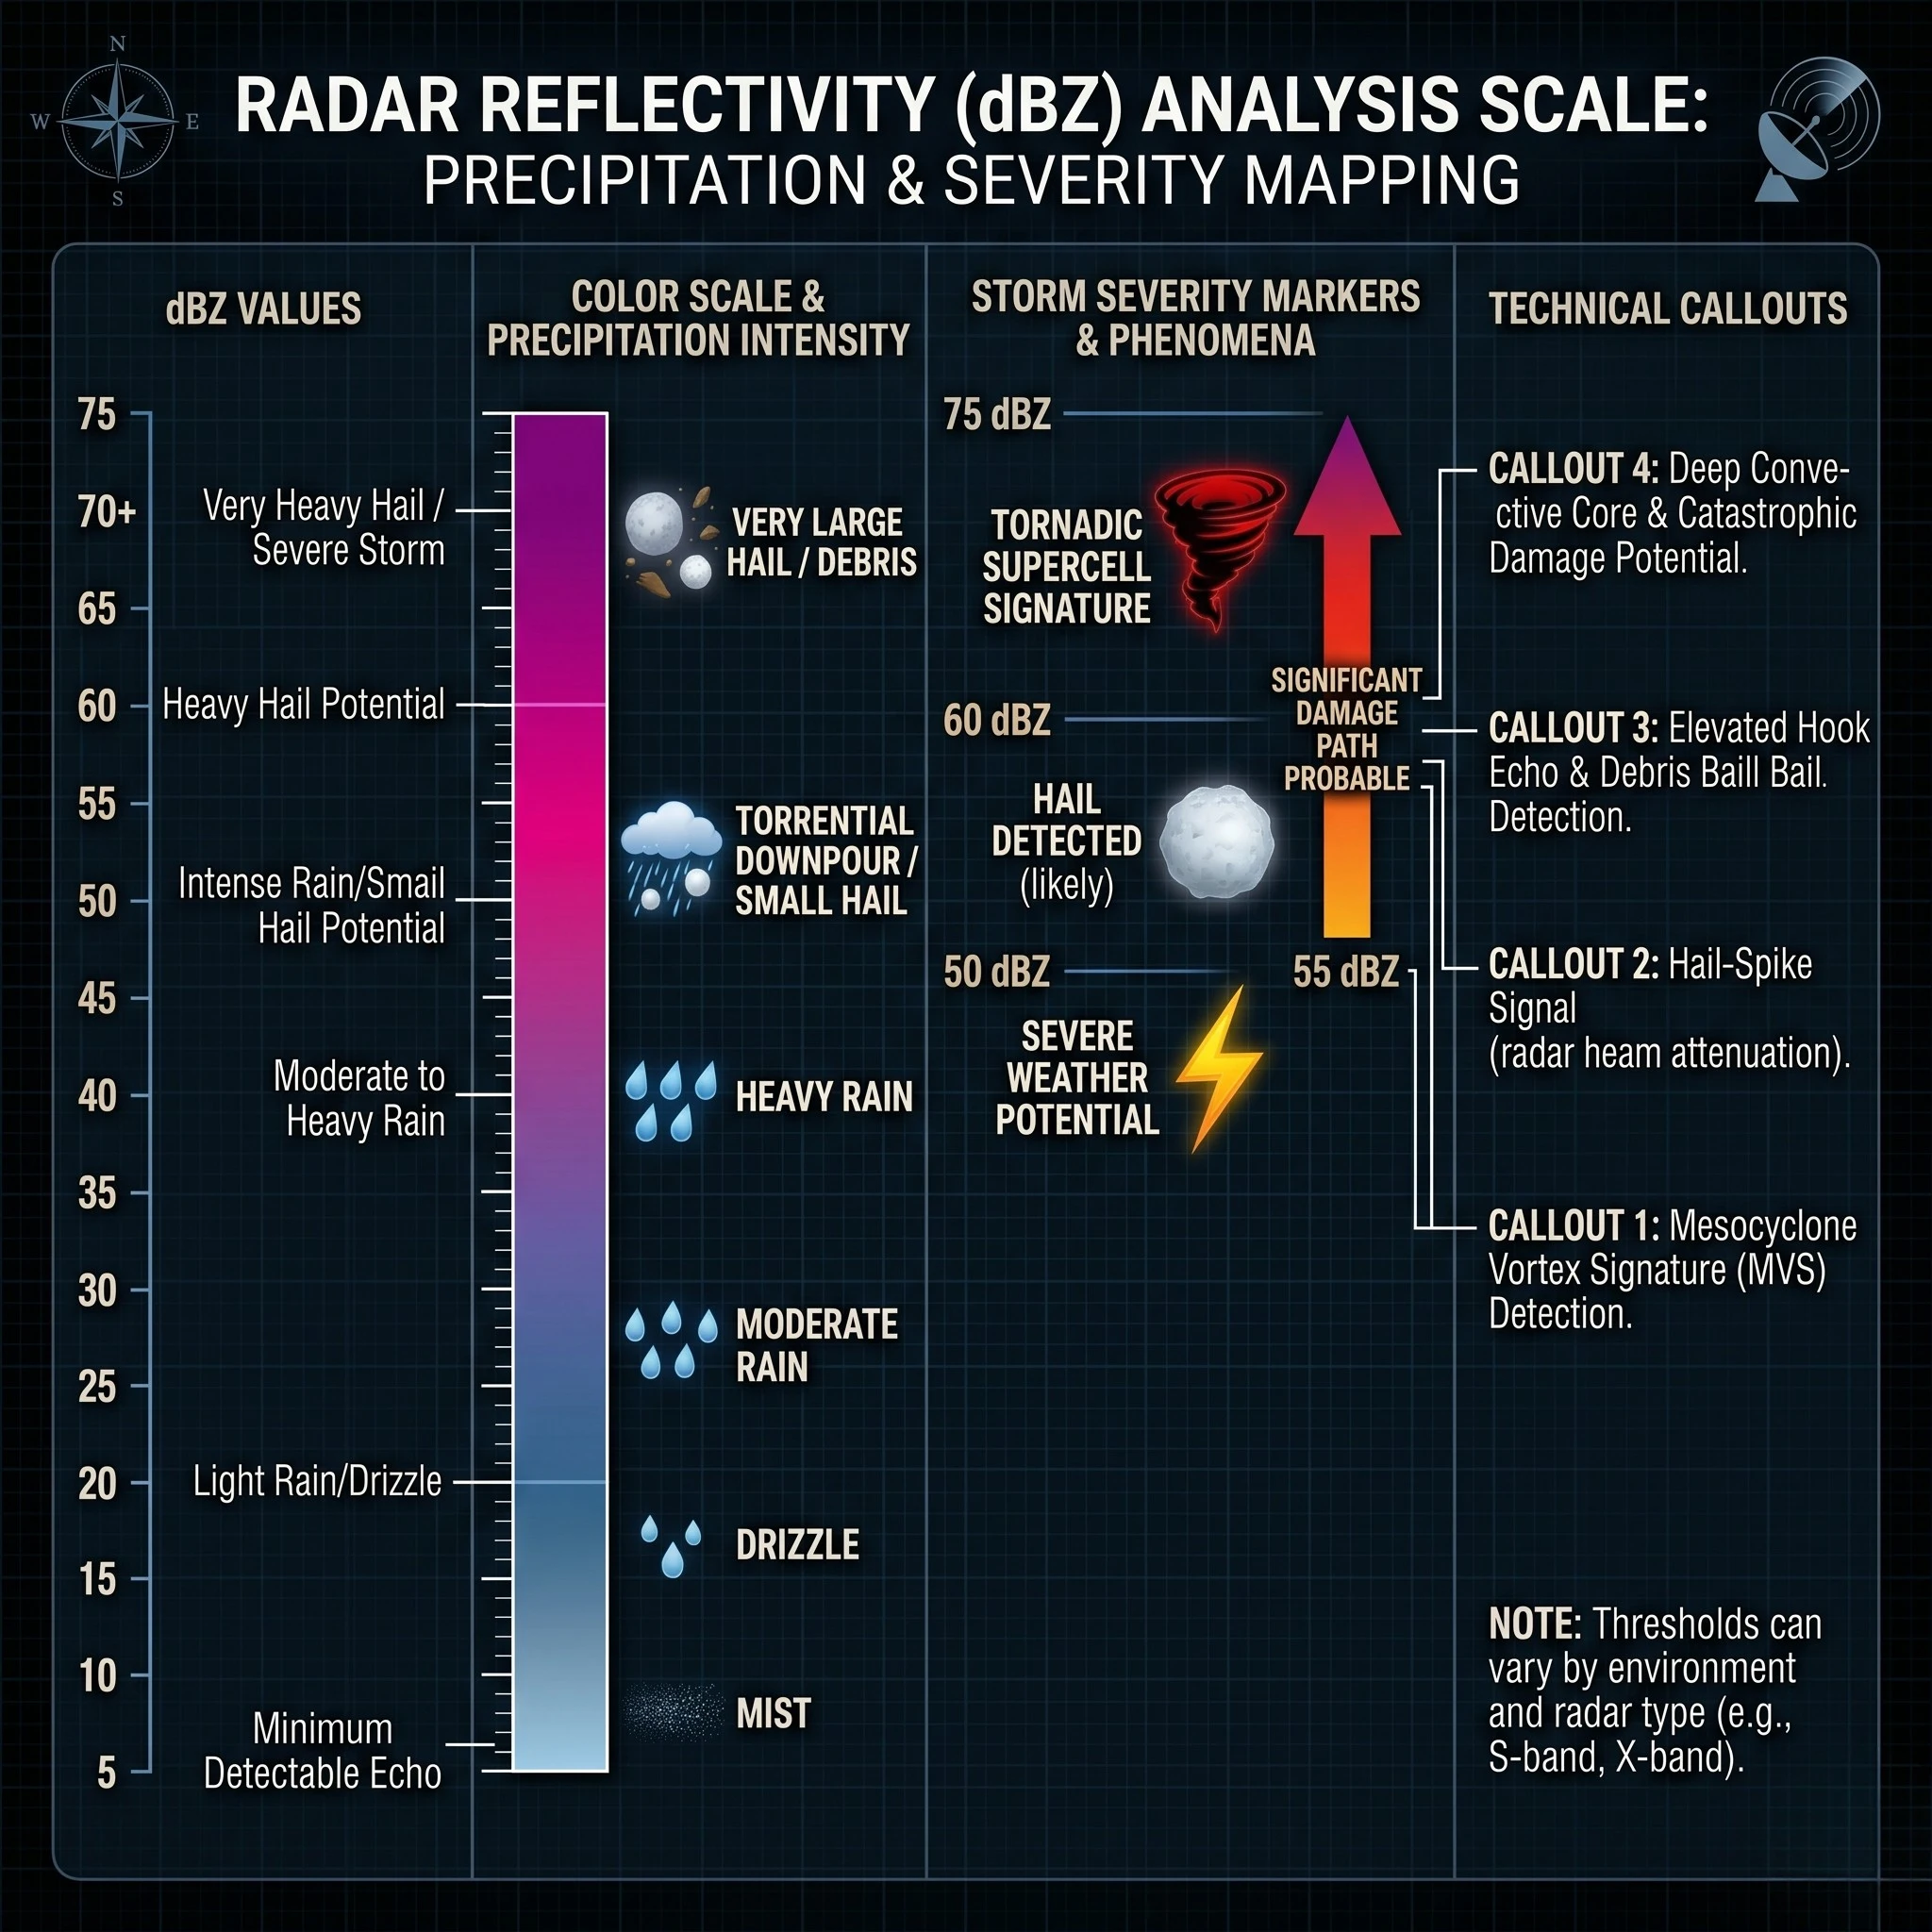
Radar overlays are the most critical tool for short-term convective tracking. Standard weather apps show base reflectivity, which measures the strength of the energy reflected back to the radar antenna from hydrometeors (rain, snow, hail).
Reflectivity and Storm Severity
Reflectivity is measured in decibels of reflectivity ($Z$), expressed as $\text{dBZ}$. The scale typically ranges from 5 $\text{dBZ}$ (light mist) to 75 $\text{dBZ}$ (extreme hail).
- Green/Blue (15–30 dBZ): Indicates light to moderate stratiform rain.
- Yellow/Orange (35–45 dBZ): Signals convective cells with moderate to heavy precipitation.
- Red/Magenta (50+ dBZ): Warns of severe thunderstorms, high winds, and potential hail.
Analyzing Radar Loop Vectoring
A single static radar image is of limited utility. The navigator must loop the radar for at least 30 minutes to determine the storm’s velocity, direction of travel (vectoring), and rate of intensification. If a convective cell is moving parallel to your valley corridor, the duration of exposure will be maximized. Understanding this movement is critical for preparing your Bikepacking Sleeping Systems before precipitation begins. For official real-time radar data, consult the National Weather Service.
3. Windy App: The Gold Standard for Wind and Jet Stream Analysis
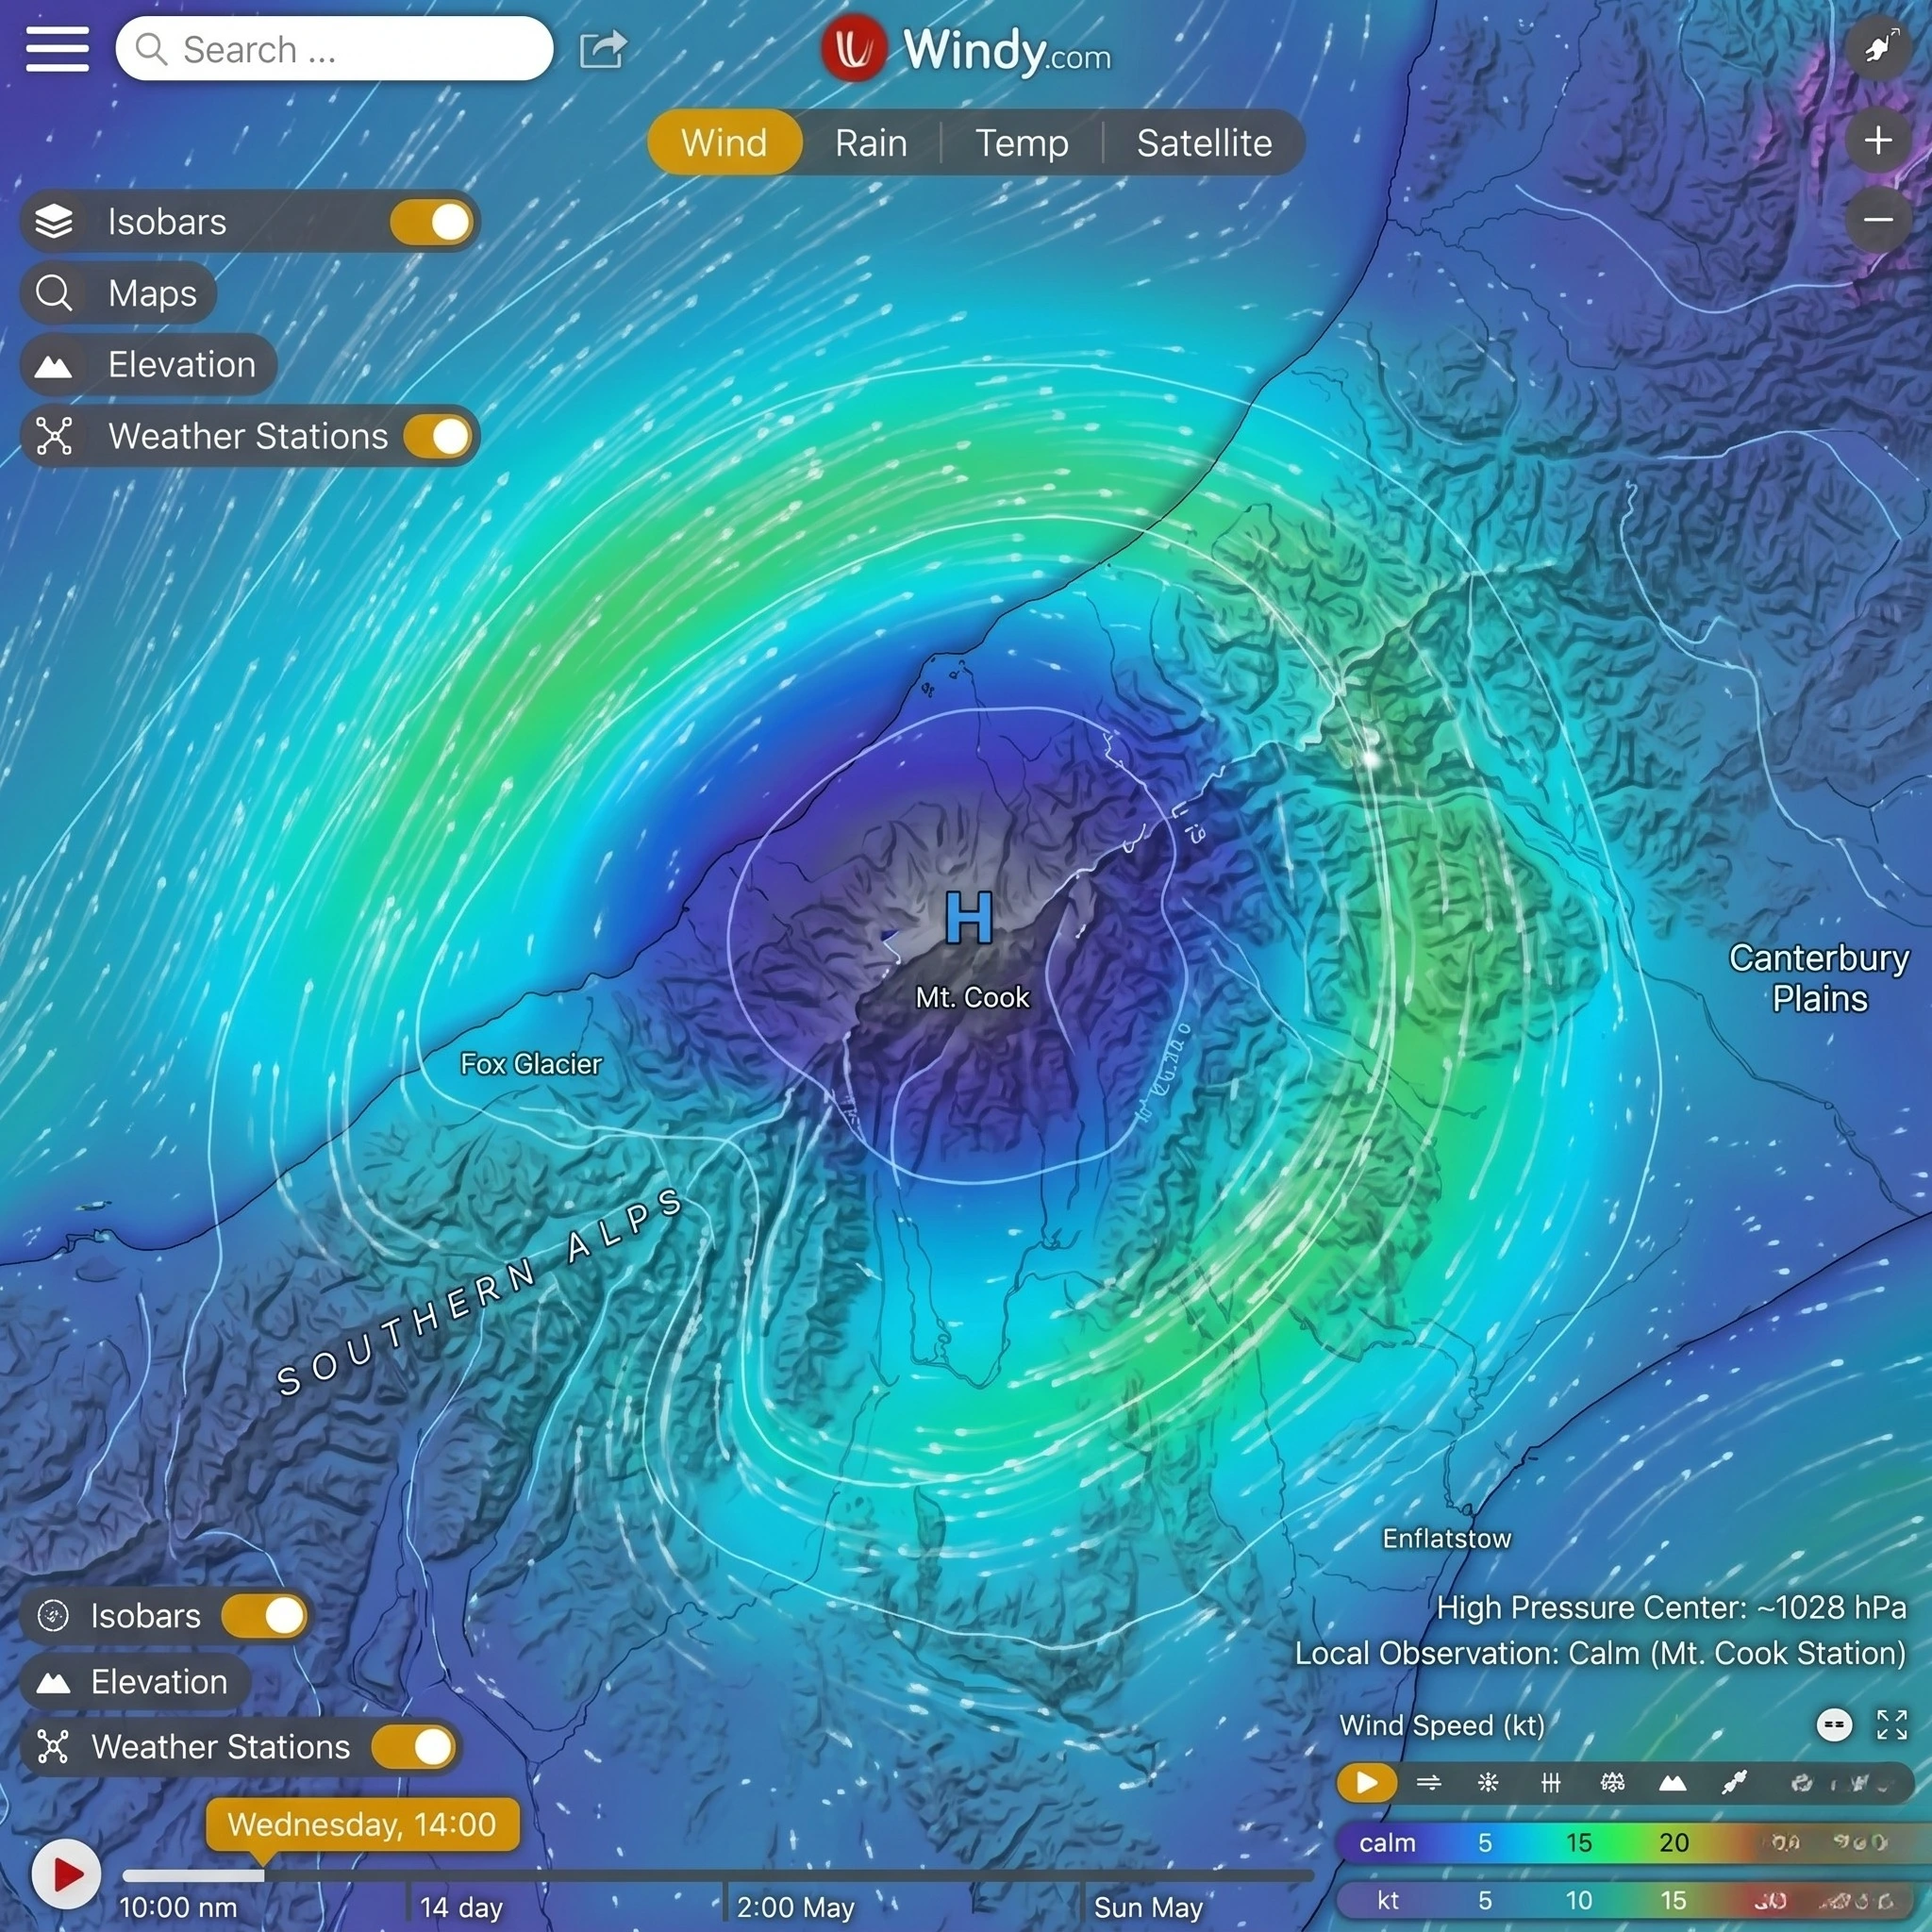
For advanced microclimate forecasting, the Windy App Interface is an indispensable resource. Unlike basic consumer weather apps, it allows users to overlay multiple wind, pressure, and temperature layers to visualize atmospheric fluid dynamics in real time.
Technical Key Interface Features
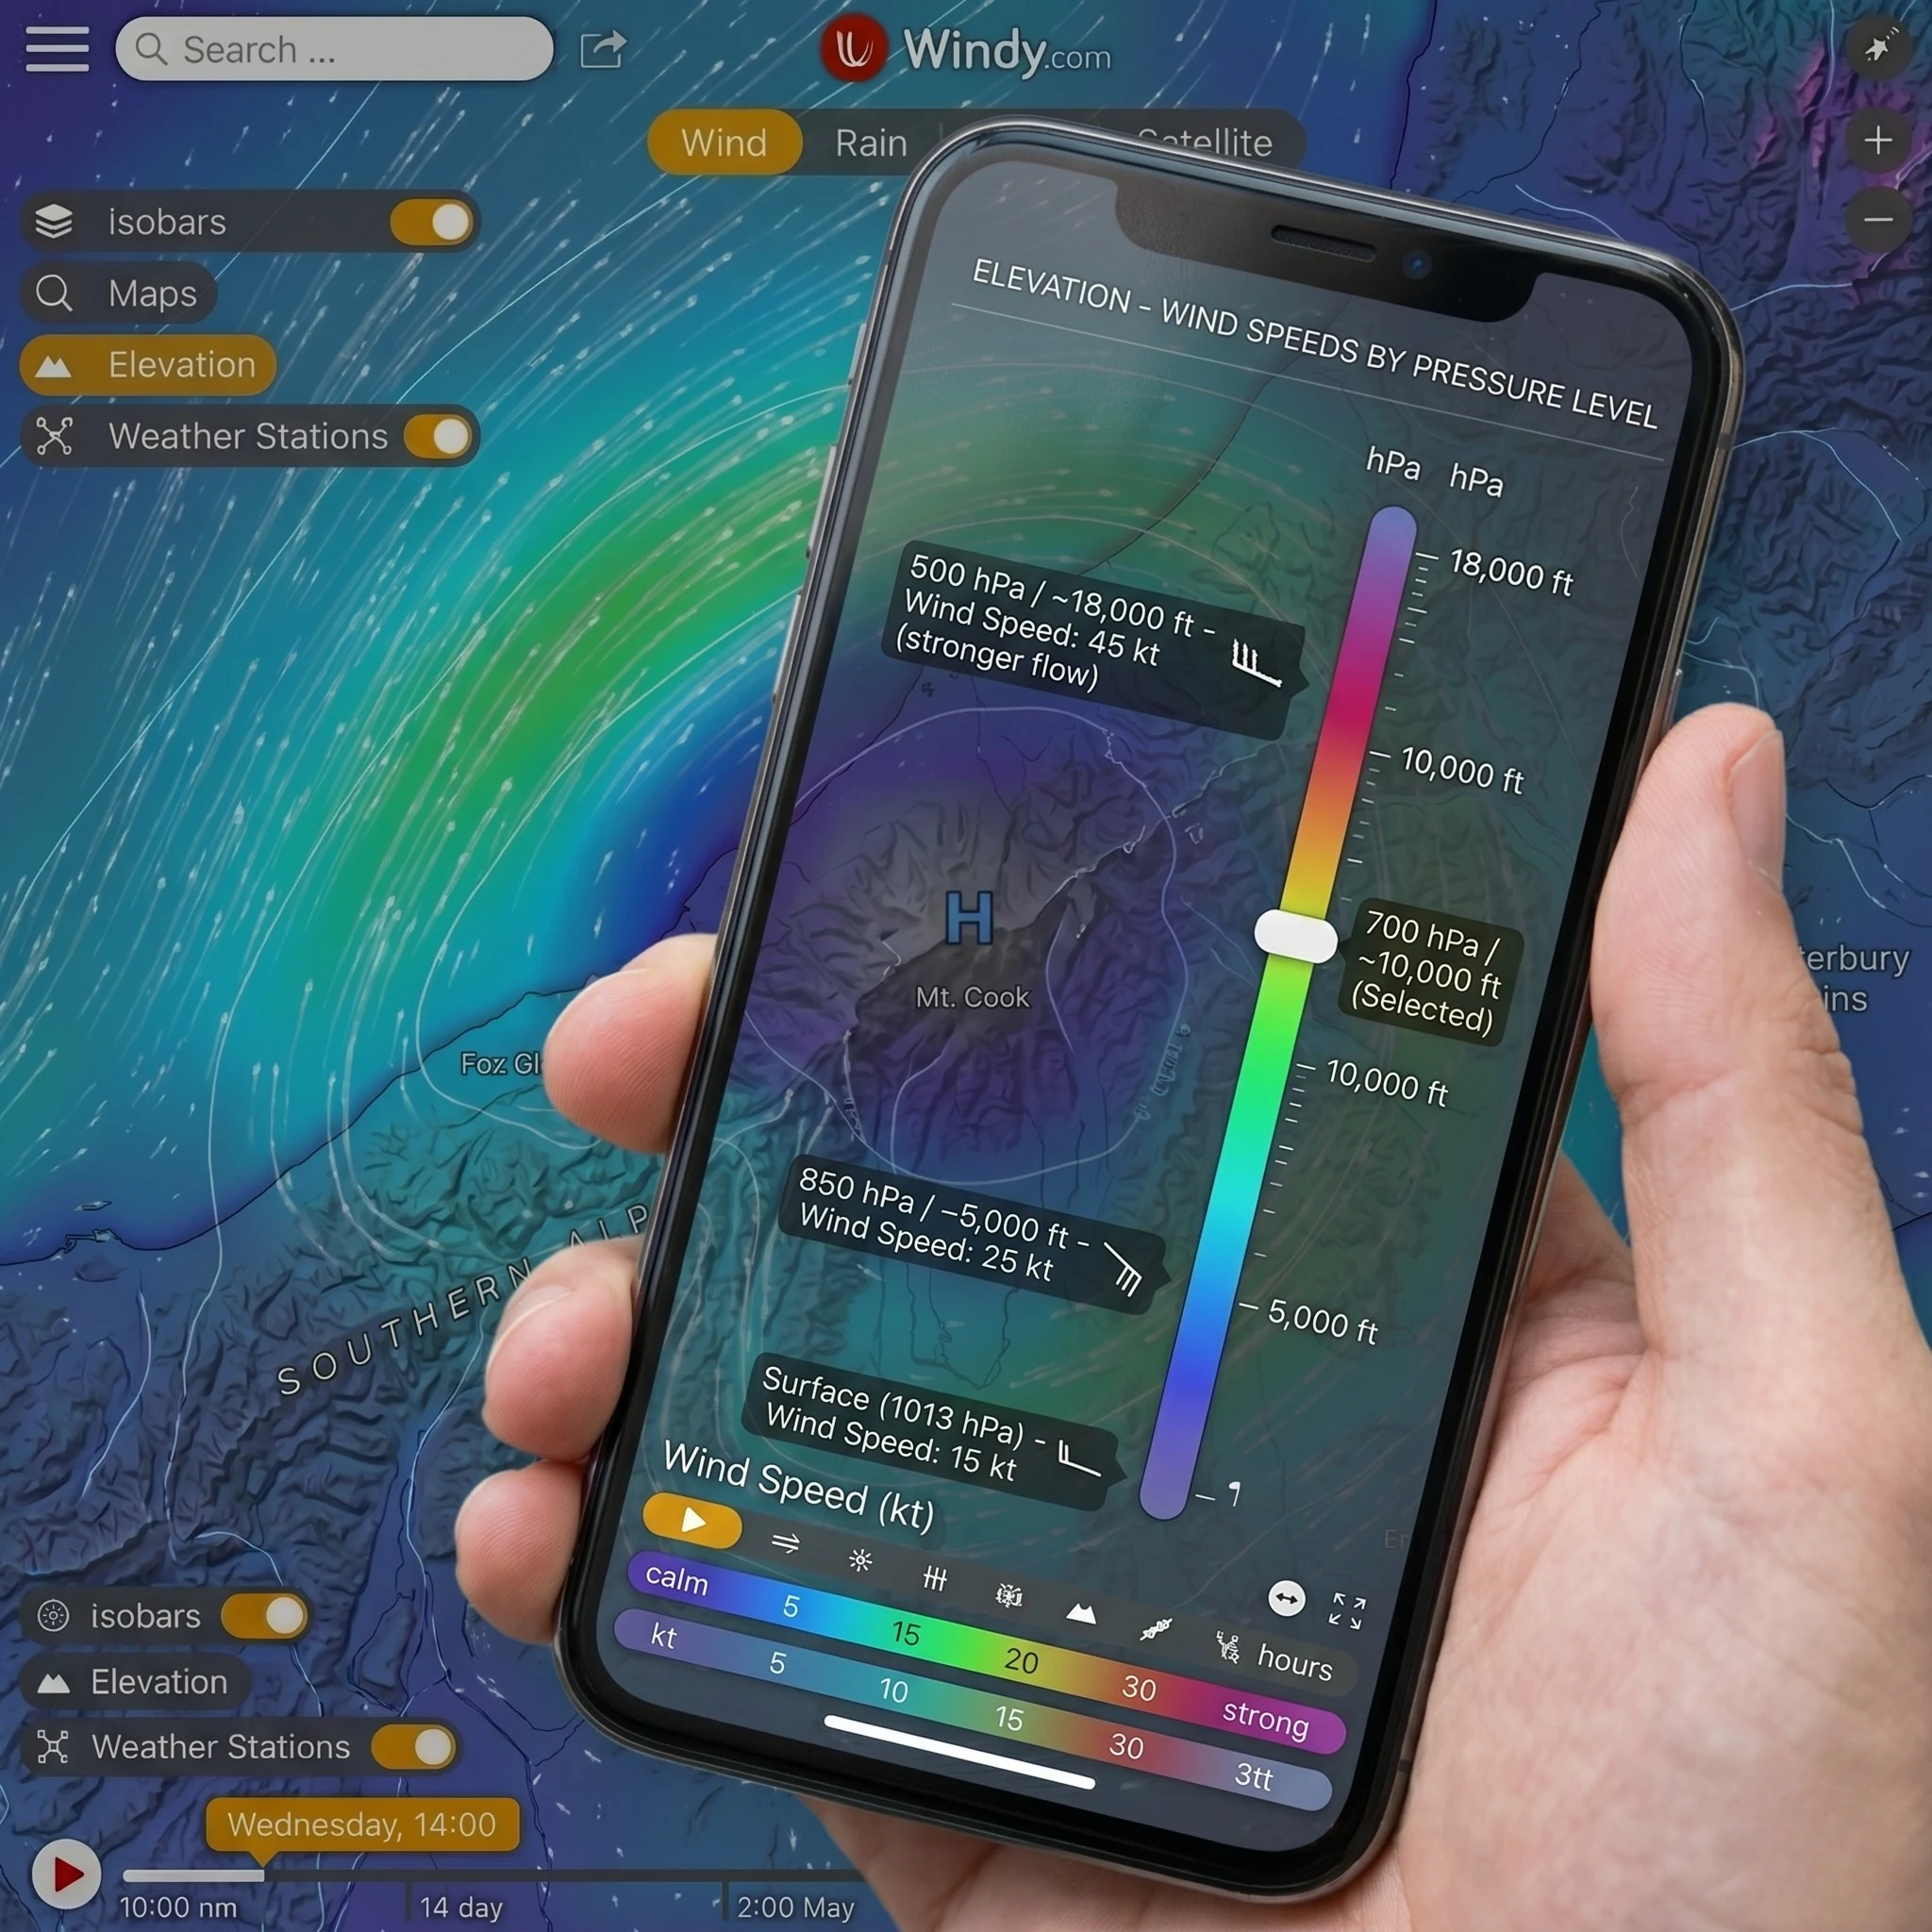
Windy displays wind vectors as moving particles, making it easy to identify wind shear and pressure boundaries. By adjusting the altitude slider, the user can analyze wind speed from ground level up to the jet stream level ($30,000\text{ feet}$). High wind speeds at upper levels often indicate the fast approach of a low-pressure front, even if ground-level winds are currently calm.
Pros and Cons of Windy
- Pros: Access to multiple NWP models (ECMWF, GFS, ICON, HRRR); real-time satellite and radar integration; advanced cape (Convective Available Potential Energy) indexing.
- Cons: High battery consumption due to continuous graphic rendering; steep learning curve for non-meteorologists.
4. Satellite Imagery: Visible, Infrared, and Water Vapor Layers
When outside of terrestrial radar range, satellite imagery is the primary method used to predict trail weather. Modern applications offer three distinct satellite views, each serving a specific analytical purpose.